Performance
FSO PERFORMANCE
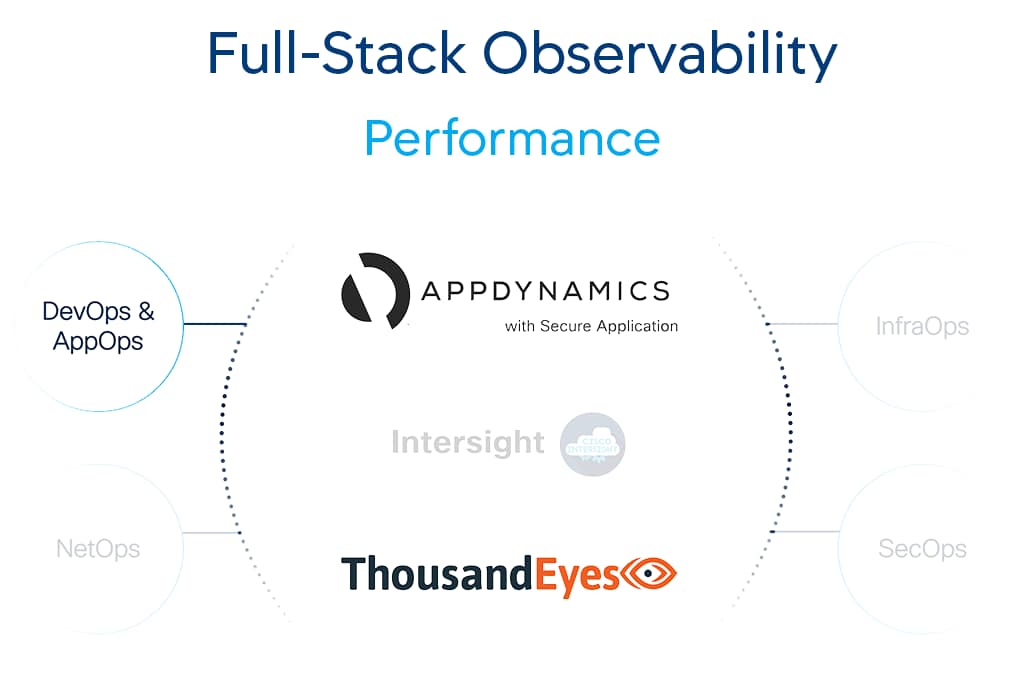
In this “Better Together” story let’s explore how AppDynamics and ThousandEyes combined capabilities enable DevOps and AppOps teams to gain a deeper visibility into the application’s performance while data is “at rest” or “in transit”.
Learning Objectives
- Understand how AppDynamics and ThousandEyes bring more value together
- Get hands on experience on how to combine both solutions (AppDynamics and ThousandEyes)
- Explore scenarios where performance degradation can be quickly analyzed and triaged using the visibility gained by using AppDynamics and ThousandEyes
Who Can Benefit?
- DevOps: By enabling a tight feedback loop for the software delivery life cycle
- AppOps: By improving triage capabilities for the internet and deployment environments
Section’s Structure
This section covers four main topics:
- Hybrid Application Monitoring
- Cloud Native Application Monitoring
- Customer Digital Experience Monitoring
- Application Dependency Monitoring
HYBRID APP MONITORING
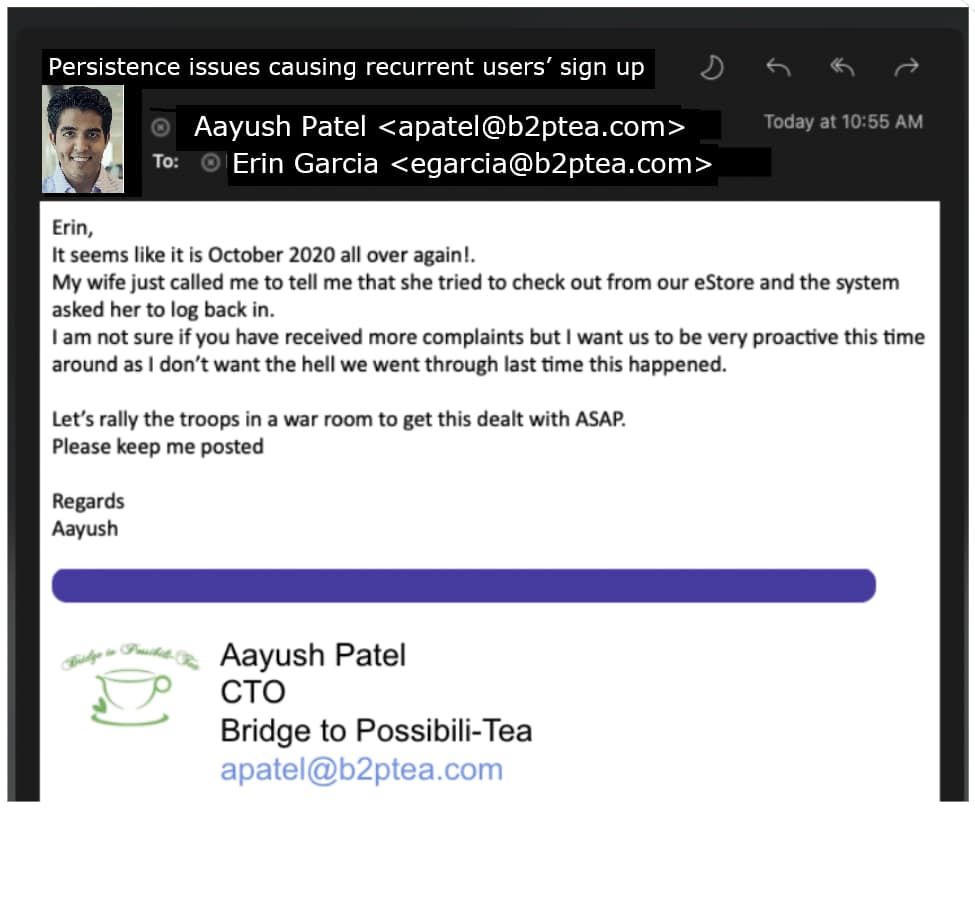
Erin is the Director of Applications and Monitoring and is in the middle of a digital transformation effort that involves a hybrid environment with canary testing and re-factoring into microservices.

These kind of efforts are usually aimed to improve companies’ bottom line by means of:
- Keeping competition at bay and/or gaining market share
- Containing brand degradation and/or customers’ churn
- Simplifing operations, reducing costs and accelerating innovation
Current situation
Rapid growth in market share has forced Erin’s team to accelerate Bridge to Possibili-Tea’s digital transformation journey as they move into the cloud.
There are multiple paradigm shifts happening at the same time:
- Moving from monolithic to microservices architecture
- Adopting distributed/hybrid deployments
- Embracing DevOps methodologies
All of these are causing old and new challenges to be looked at through a different set of lenses.
Cisco’s FSO - Performance
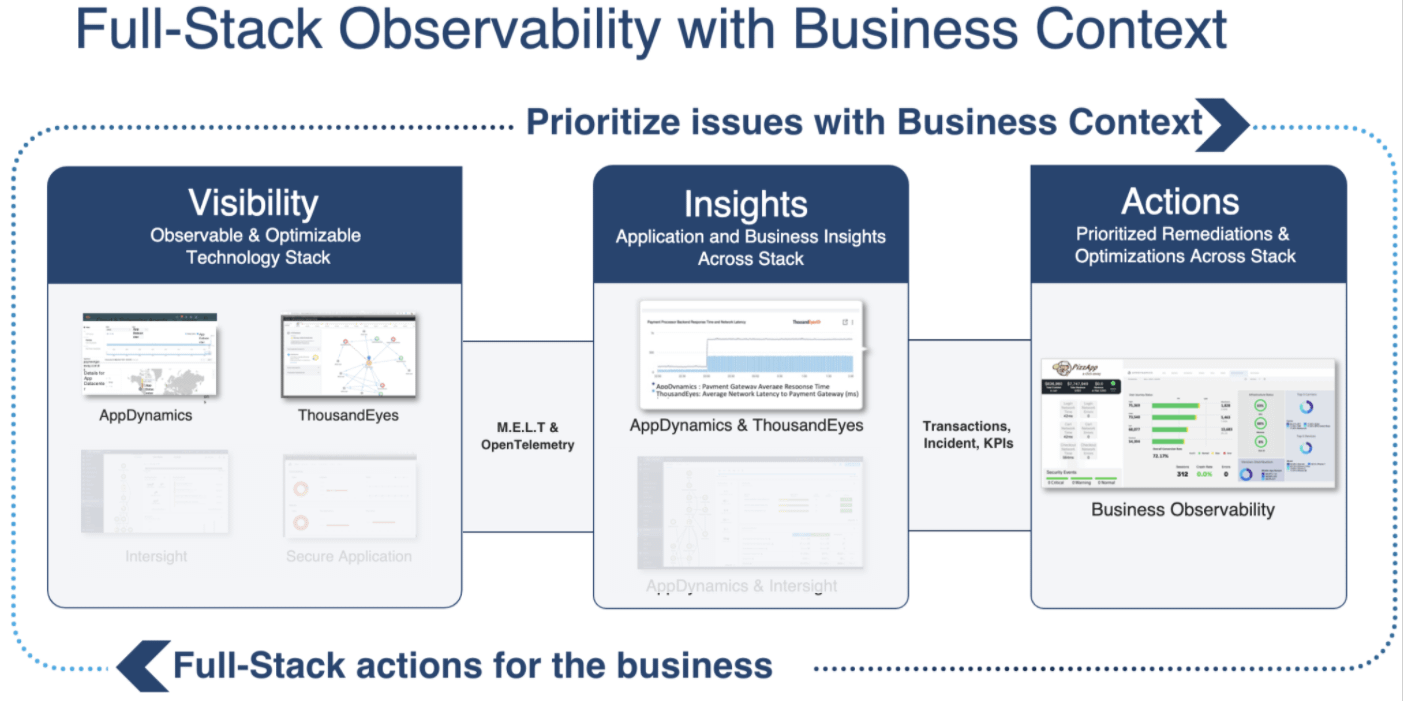
Performance assurance has been traditionally driven by a set of siloed sources of information (Metrics, Events, Logs, Traces and KPIs) which require a significant effort for them to be correlated.

With modern architectures this approach is increasingly unsustainable as correlating the information has become exponentially complex with applications spreading across multiple platforms, technologies and vendors.
Finding an easy way to make sense of all this data and act upon it in a timely manner has now become of paramount importance for any business.
Cisco’s Full Stack Observability – Performance has been built to provide exactly that: Automated visibility, insights and actions that minimizes the friction of keeping your applications running at top performance.
Why should Erin care?
Erin is aware that finding and retaining good talent is difficult specially in a hot market like technology is these days so she now understands that she needs to put mechanisms in place to reduce the burden that performance assurance inflicts on the team.
She needs a solution that effortlessly exposes their performance weaknesses such that minimal intervention from her team is required to reach targets while still innovating at an accelerated pace.
It is clear that the more time it takes to deploy such solution the less likely Erin will be able to meet the targets, keep the competition at bay and retain the talent she needs to succeed.
Next we’ll walk through the steps to configure health rules and a custom dashboard within AppDynamics.
HANDS-ON CONFIGURATION
In this section we’ll walk through the steps to configure health rules and widgets on a custom dashboard within AppDynamics so they pull their data from your specific TeaStore application instance.
You’ll use an existing health rules template and apply it to your own TeaStore application.
You will also customize the widgets in your AppDynamics custom dashboard listed below.
- Health widget for Business Transactions
- Application events widget for Critical Events
- IFrame widget for IWO Actions
Apply Health Rules Template
🔵 Use the credentials used previously to login to the AppDynamics controller if you’ve been logged out.
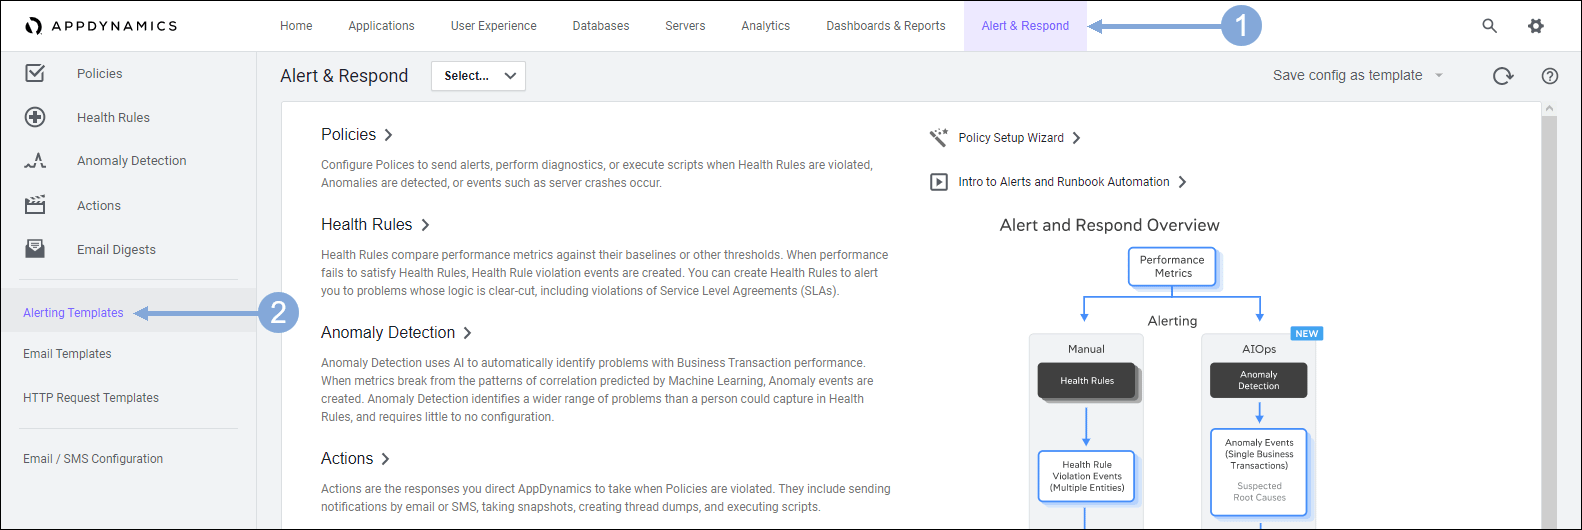
🔵 Navigate to the Health Rule template you’ll use for your TeaStore application using the steps below.
- Click on the ‘Alert & Respond’ tab on the top menu
- Click on the ‘Alerting Templates’ tab on the left menu
🔵 Select the Health Rule template to apply to your TeaStore application using the steps below.
- Find the template named ‘appd-teastore-fso-lab’ then check the box to select the template
- Click on the ‘Apply to’ button

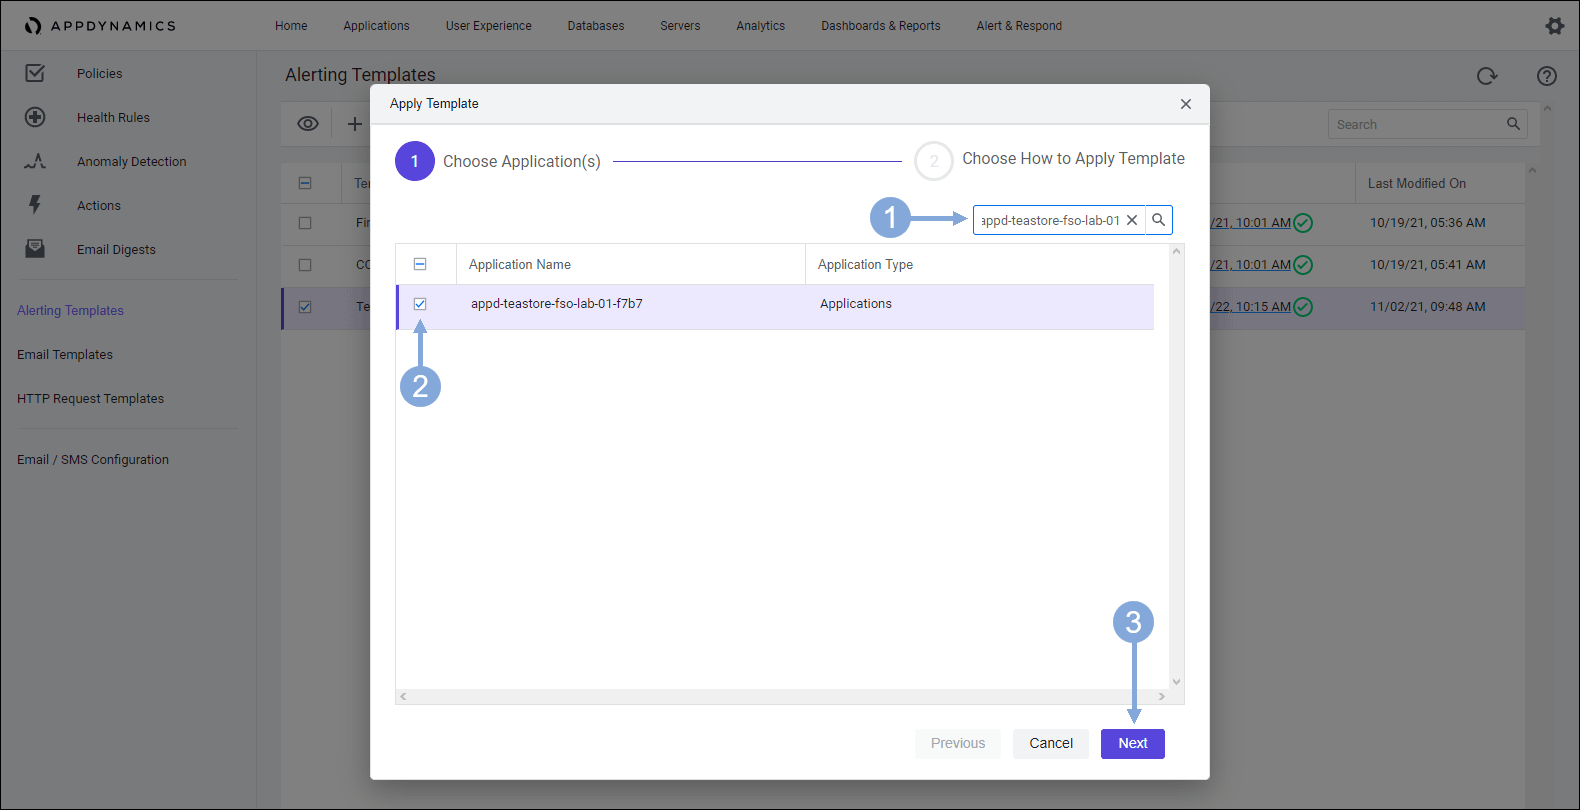
🔵 Select your TeaStore application using the steps below.
- Type in {cluster-prefix}-teastore-fso-lab-{your-lab-number} into the search box to filter the list
- Check the check box for your TeaStore application
- Click on the ‘Next’ button
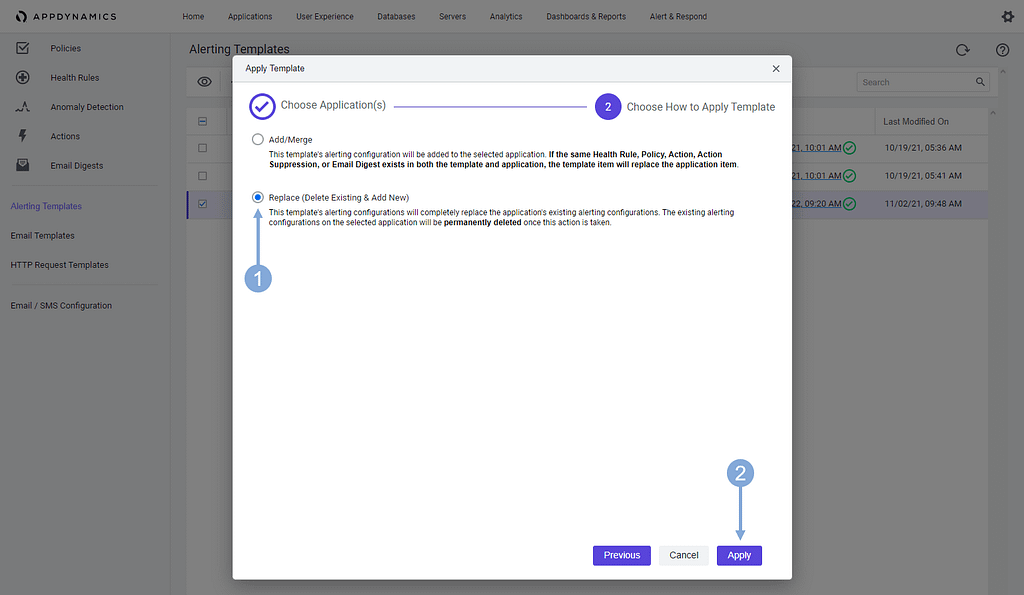
🔵 Use the steps below to finish applying the Health Rule template.
- Select the ‘Replace (Delete Existing & Add New)’ option
- Click on the ‘Apply’ button
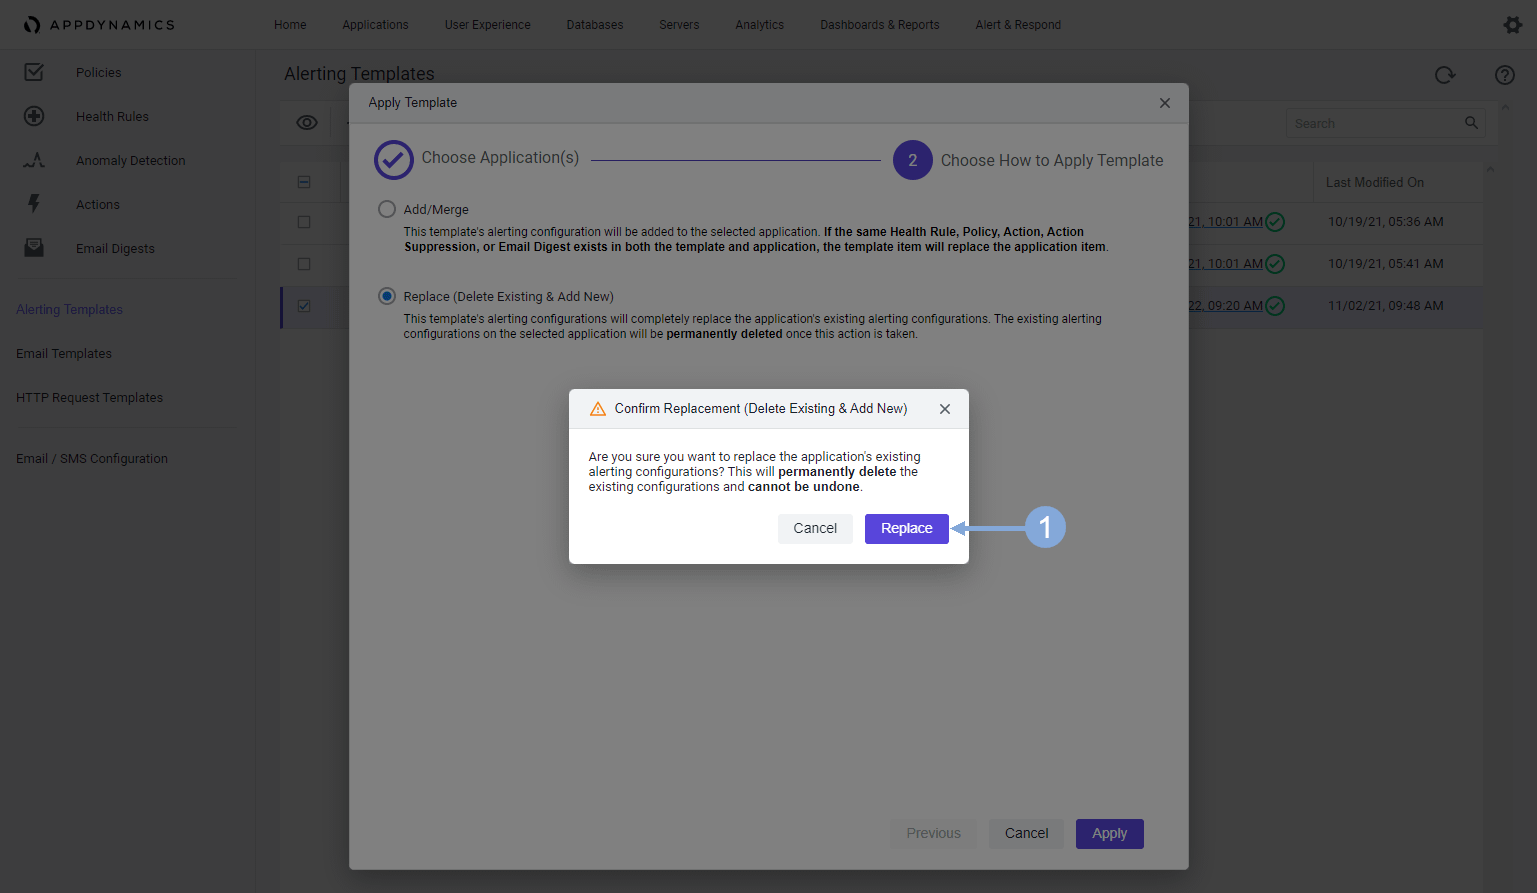
🔵 Click on the ‘Replace’ button when the confirmation window appears.
Update BT Health Widget
🔵 Open your custom dashboard using the steps below.
- Click on the ‘Dashboards & Reports’ tab on the top menu
- Double-click on the dashboard you see in the list (there should be only one)

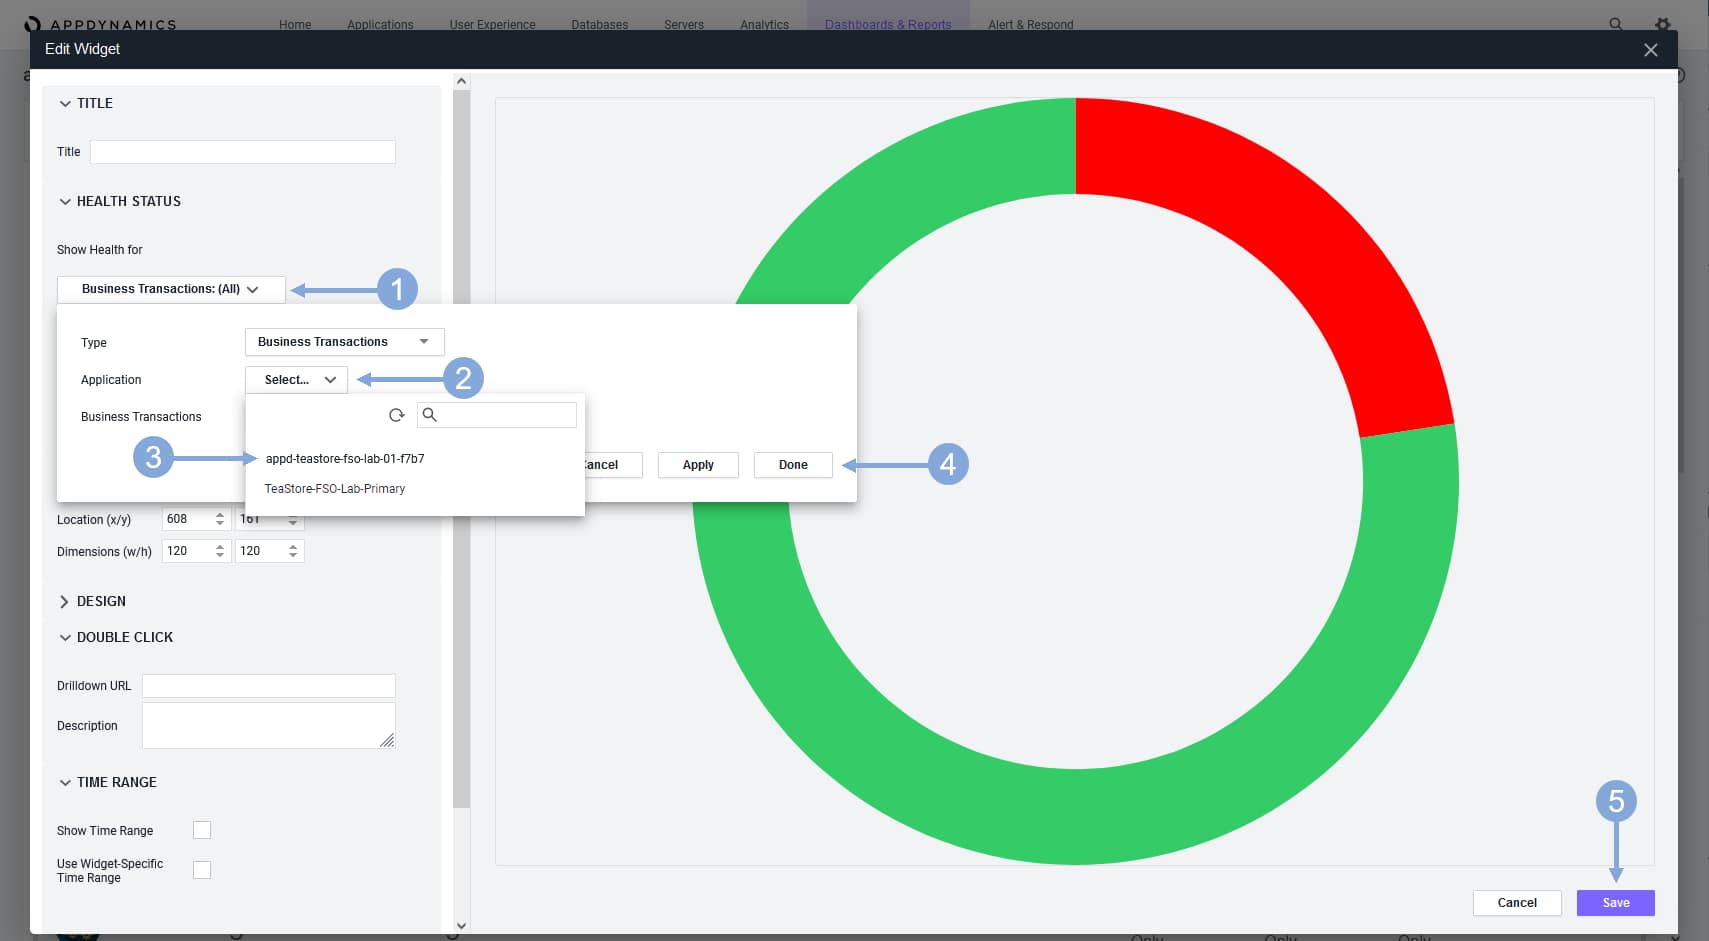
🔵 Update the Health Widget for Business Transactions on your custom dashboard to point to your TeaStore application using the steps below.
- Click on the ‘Edit’ toggle button to switch to edit mode
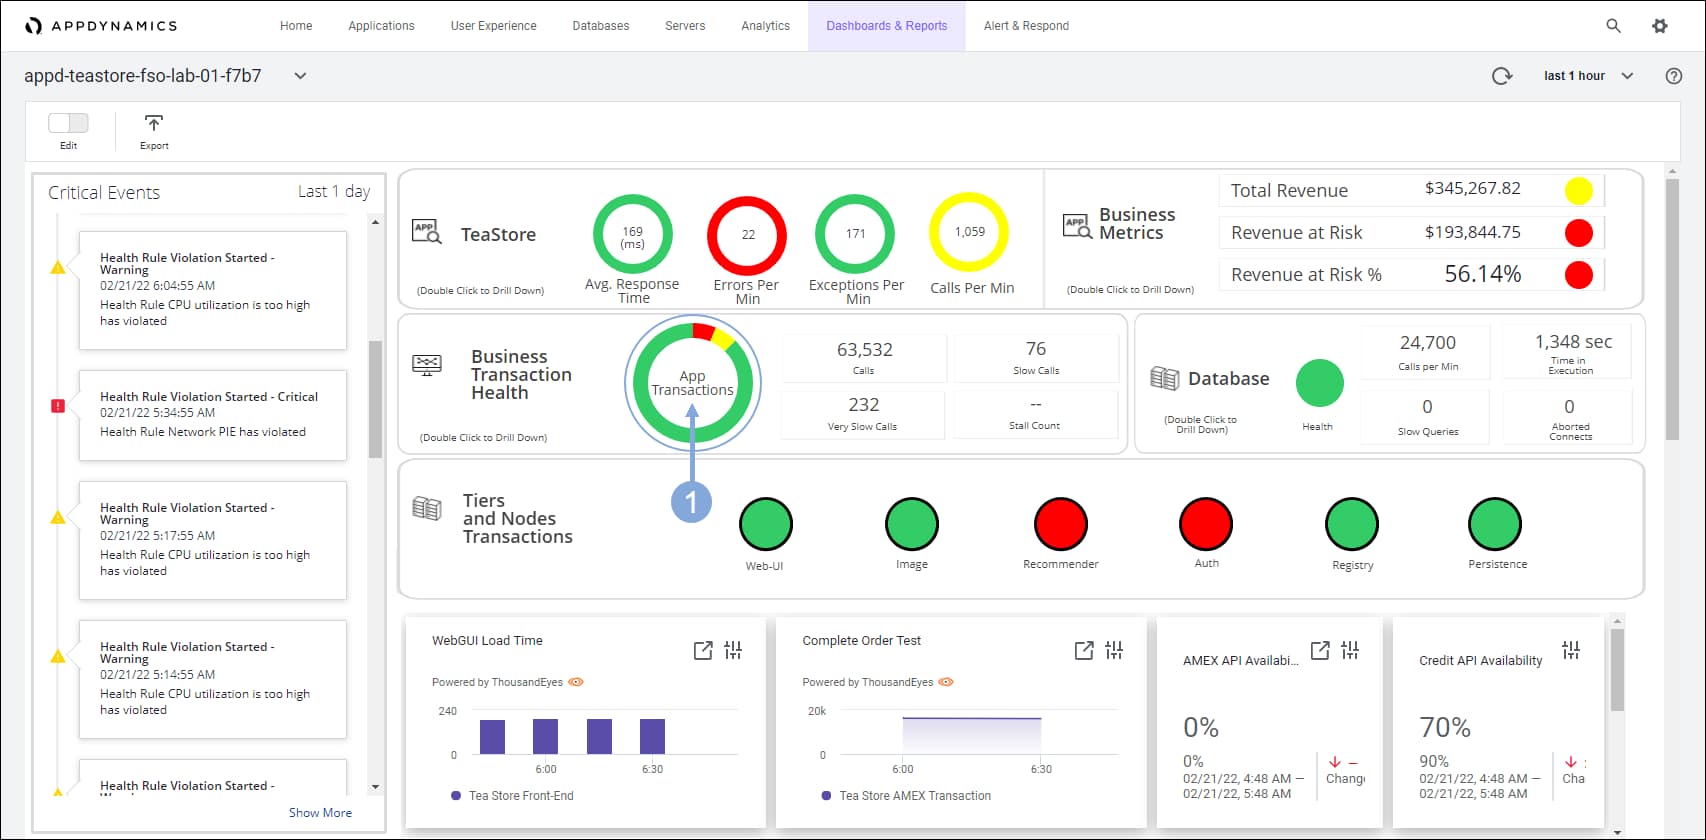
- Click on the ‘App Transactions’ circular health rule widget so that it is framed in blue
- Click on the ‘Edit’ button with the pencil icon

🔵 Use the steps below change the settings on the widget to point to your TeaStore application.
- Click on the ‘Business Transactions’ drop-down
- Click on the ‘Select’ drop-down for Application
- Select the TeaStore application named with your lab number
- Click on the ‘Done’ button
- Click on the ‘Save’ button
Update Critical Events Widget
🔵 Update the Events Widget for Critical Events on your custom dashboard to point to your TeaStore application using the steps below.
- Click on the ‘Critical Events’ widget so that it is framed in blue
- Click on the ‘Edit’ button with the pencil icon

🔵 Use the steps below change the settings on the widget to point to your TeaStore application.
- Click on the ‘Data Source’ drop-down
- Click on the ‘Applications’
- Select the TeaStore application named with your lab number
- Click on the ‘Save’ button
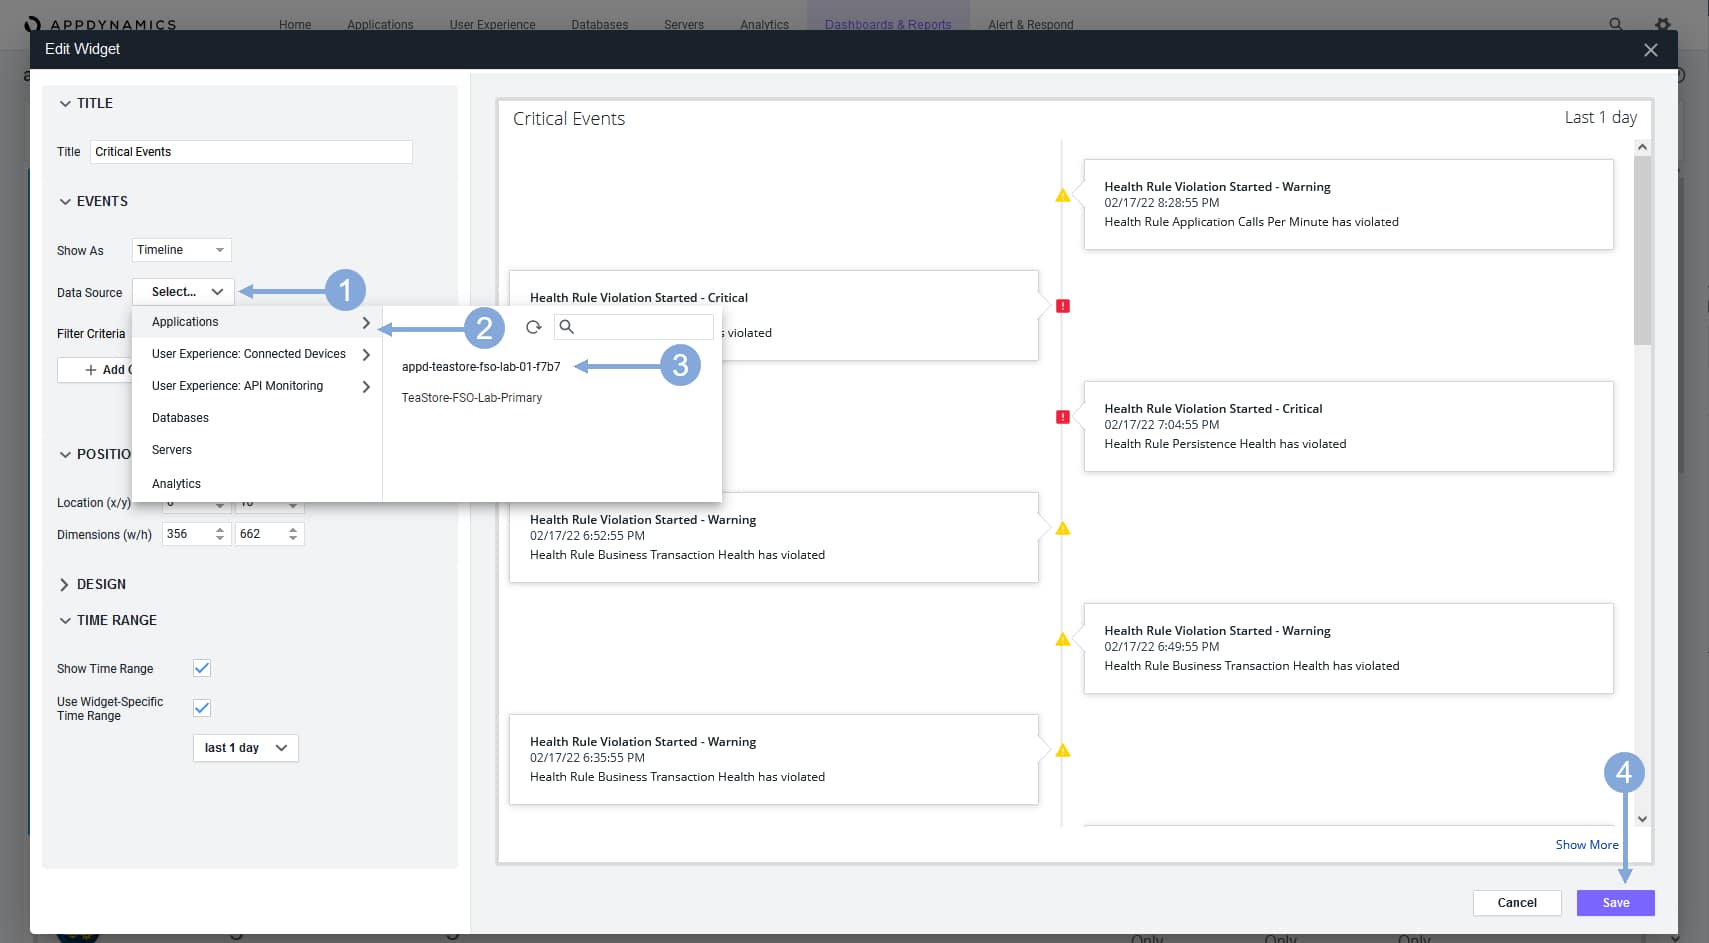
🔵 Now click on the ‘Save’ button to save your changes to the dashboard.

Initialize IWO Action Integration
The IWO Action Integration is a simple NodeJS application that is meant to show the art of the possible by adding the pending recommended actions from IWO into your AppDynamics dashboard to provide a more holistic view of the state of your application.
🔵 Two prerequisites have already been done for you but are documented below.
🔵 You do not need to do these steps in the lab, they are for reference only.
- The two key files have been created in the keys directory
- You can read how to create a new API key for OpenAPI schema version 2 in Intersight here
- The value for the API Key ID should go in the iwo_public_key.txt file in the keys directory
- The value for the Secret Key should go in the iwo_private_key.pem file in the keys directory
- The config.json file has been created for you and configured to listen on port 8080
- The other values in the config.json file would remain unchanged
You can find the instructions for these prerequisites in the GitHub repository for the IWO Action Integration.

🔵 Let’s proceed to the next steps you’ll need to perform. Open a new terminal window in your Cloud9 IDE
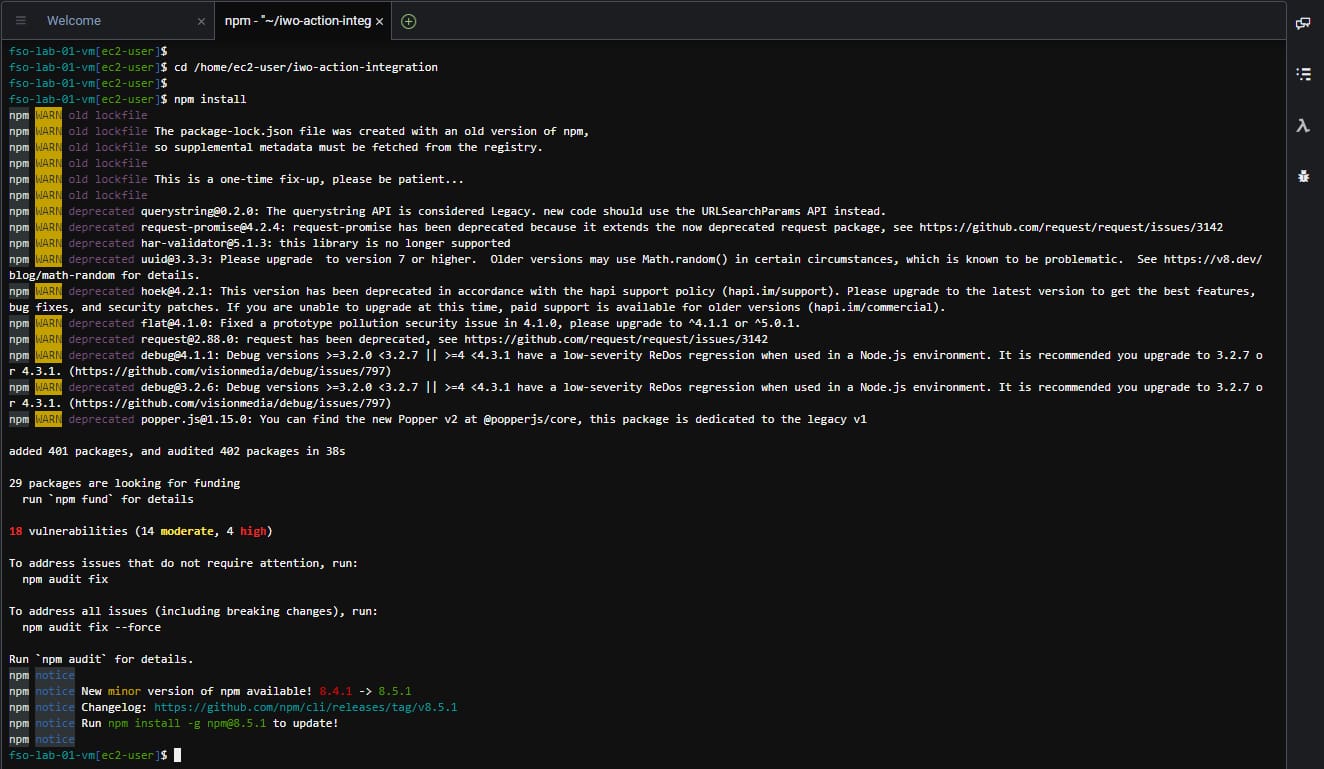
🔵 Update the dependencies for the IWO Action Integration application using the commands below.
cd /home/ec2-user/iwo-action-integration
npm install
The output should look like the image below.
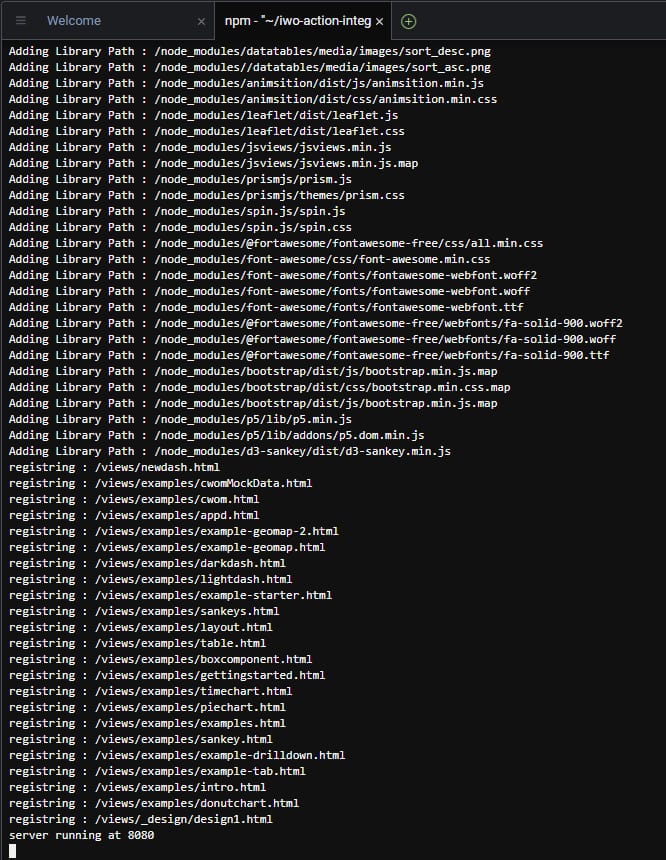
🔵 Start the IWO Action Integration application using the commands below in the same Cloud9 terminal used in the last step.
cd /home/ec2-user/iwo-action-integration
npm start
The output should look like the image below. Leave the appplication running in the terminal window. If it stops for any reason simply restart it using the same commands above.
Obtain URL for IWO Action Integration
🔵 Use the steps below to obtain the URL for the IWO Action Integration application.
- Click on ‘Preview’ menu at the top of your Cloud9 IDE
- Select the ‘Preview Running Application’ from the drop-down
- Copy the URL for the application and save it for the next steps (you might need to click into the empty url field to display the url).

🔵 Use the credentials for Cisco Intersight via OKTA provided by your instructor to login to Intersight if you’ve been logged out. The instructions for logging into OKTA are located at this link: https://fso.cisco-one.com/okta/
🔵 Use the steps below to obtain the Business App Id for your application in IWO.
- Click on the ‘Business Application’ icon at the top of the Supply Chain.
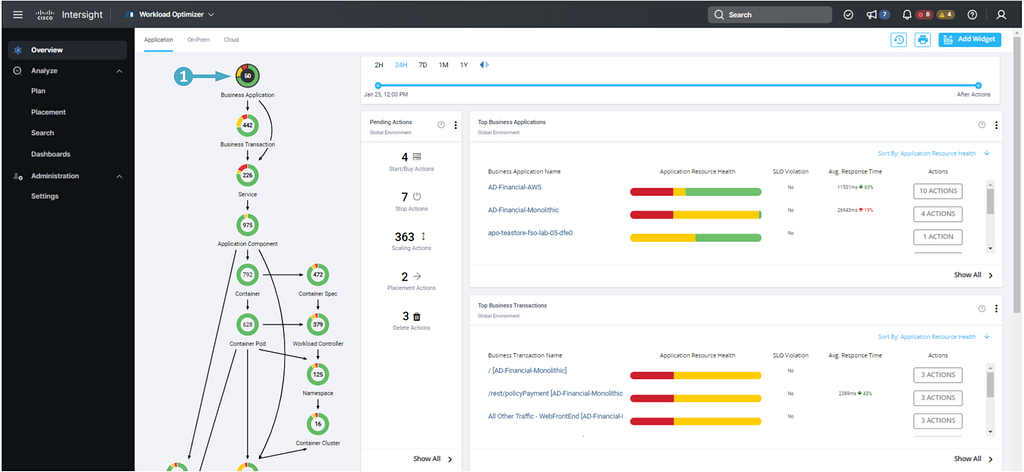

- Find the Business Application that has your lab number in the name and verify it is in the list
- If needed click the ‘Show All’ link to find your Business Application and verify it is in the list.

🔵 Once you’ve opened your business application, copy the value for the ‘viewKey’ parameter in the URL.
- Copy only the characters to the right after ‘viewKey=’ and save the value for the next step.
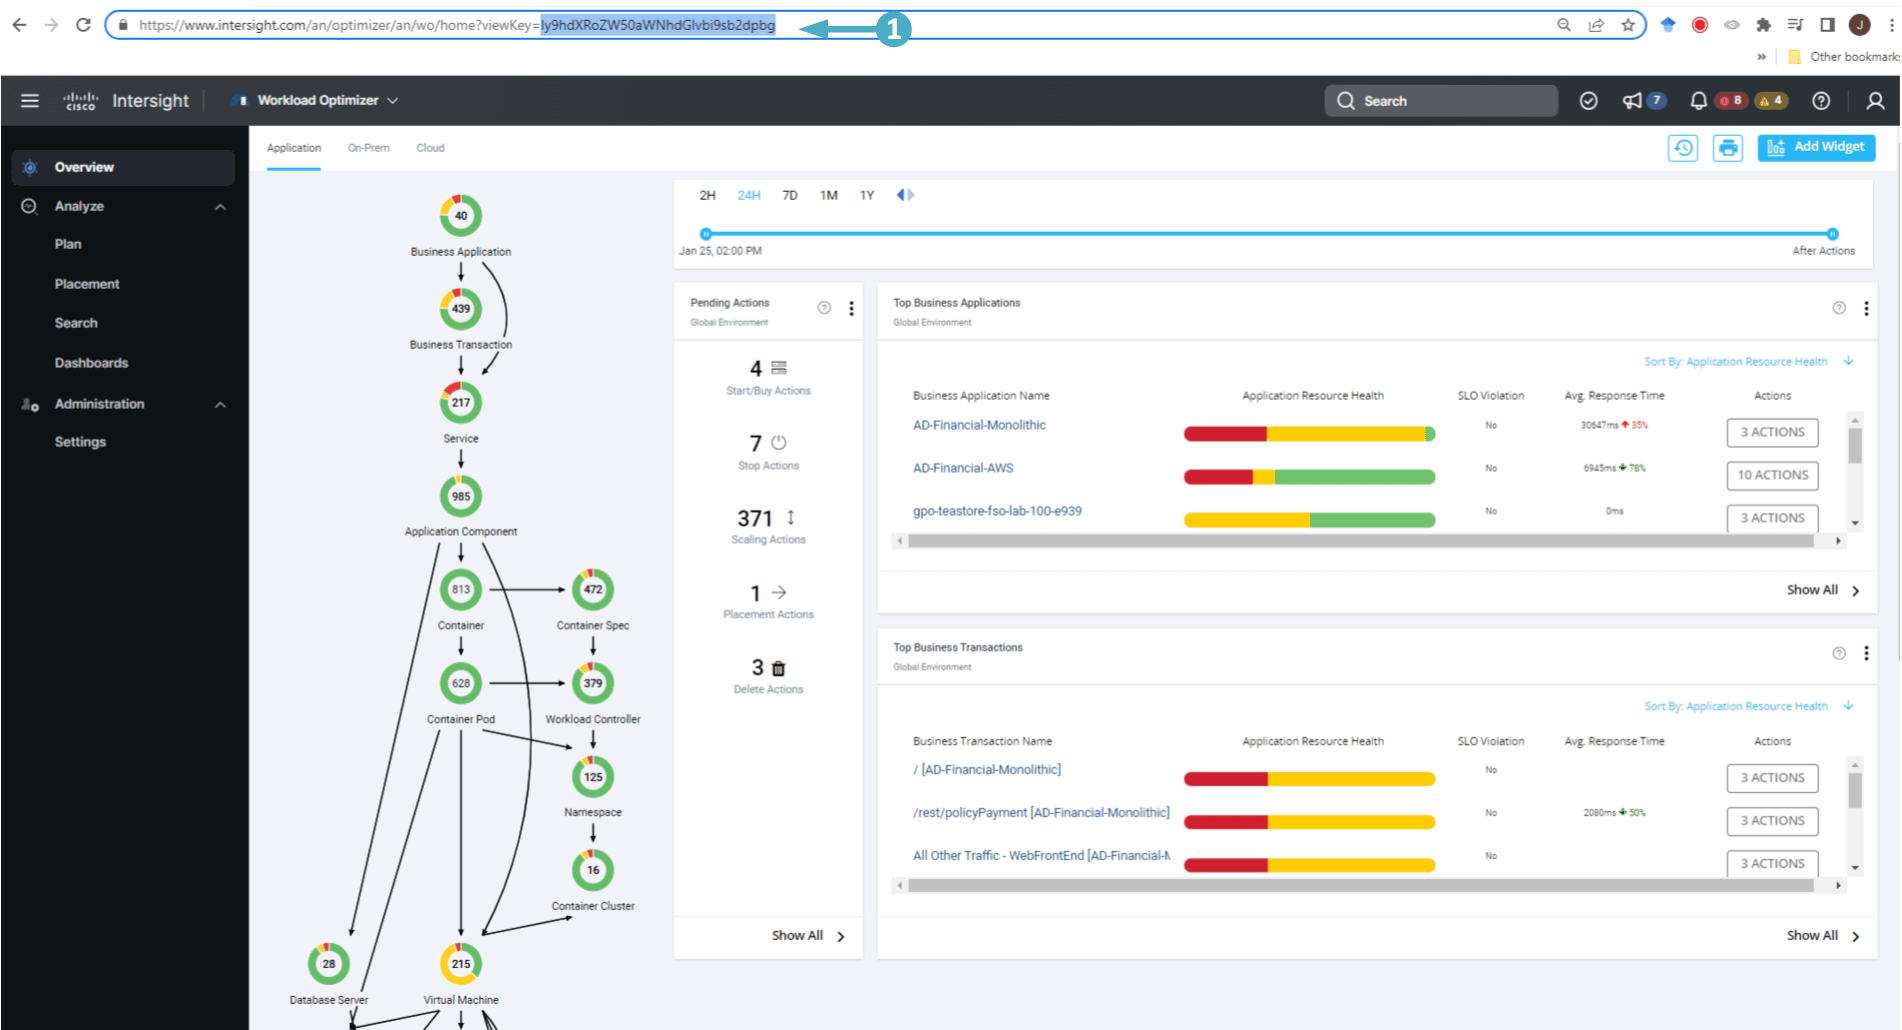
🔵 Open a new tab in your browser and go to the URL seen below.
https://www.base64decode.org
🔵 Use the steps below to decode your Business App Id.
- Paste the value for the ‘viewKey’ parameter you saved from your prior step
- Click on the ‘Decode’ button
- Copy the decoded value and save the value for the next step (copy only the numeric characters)
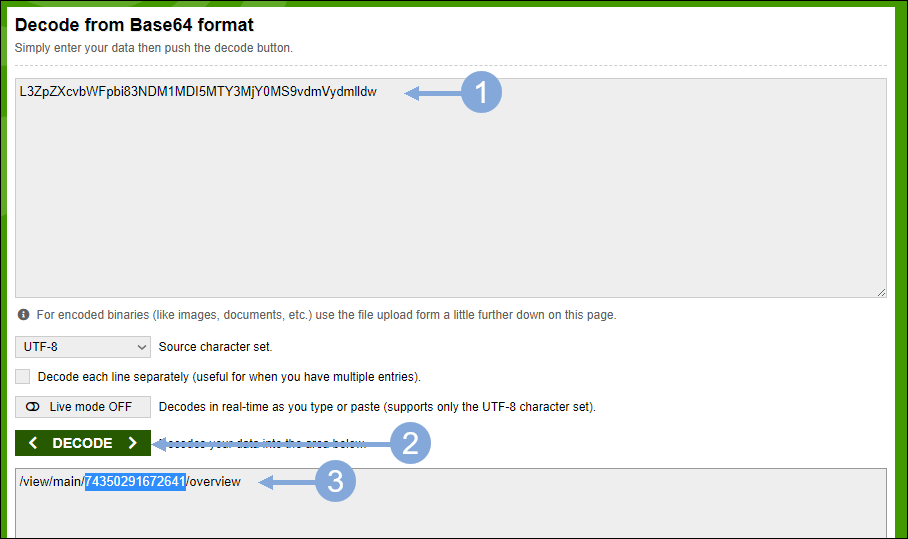
🔵 Now use the steps below to construct the final URL you will use in the next exercise.
- Start with the URL for the IWO Action Integration application you obtain in a previous step
- Add the following to right of that URL
- views/examples/cwom.html?businessAppID=
- Add the numeric decoded value of the business application id at the end
{IWO Action Integration URL}views/examples/cwom.html?businessAppID={Decoded Business App ID}
🔵 Your completed URL should look similar to the example seen below.
https://96be7a22af41443f915d23039a1cc8c6.vfs.cloud9.us-west-1.amazonaws.com/views/examples/cwom.html?businessAppID=74350291672641
Update IFrame Widget for IWO
🔵 Ensure you are using the same browser window where you have your Cloud9 IDE opened in when you open a new browser tab for the next step.
🔵 Open your custom dashboard in the AppDynamics controller using the first steps you used in the Update BT Widget exercise.
🔵 Update the IFrame Widget for IWO Actions on your custom dashboard to point to the IWO Action Integration application URL using the steps below.
- Click on the ‘Edit’ toggle button to switch to edit mode
- Click on the ‘IWO Actions’ iFrame widget so that it is framed in blue
- Click on the ‘Edit’ button with the pencil icon
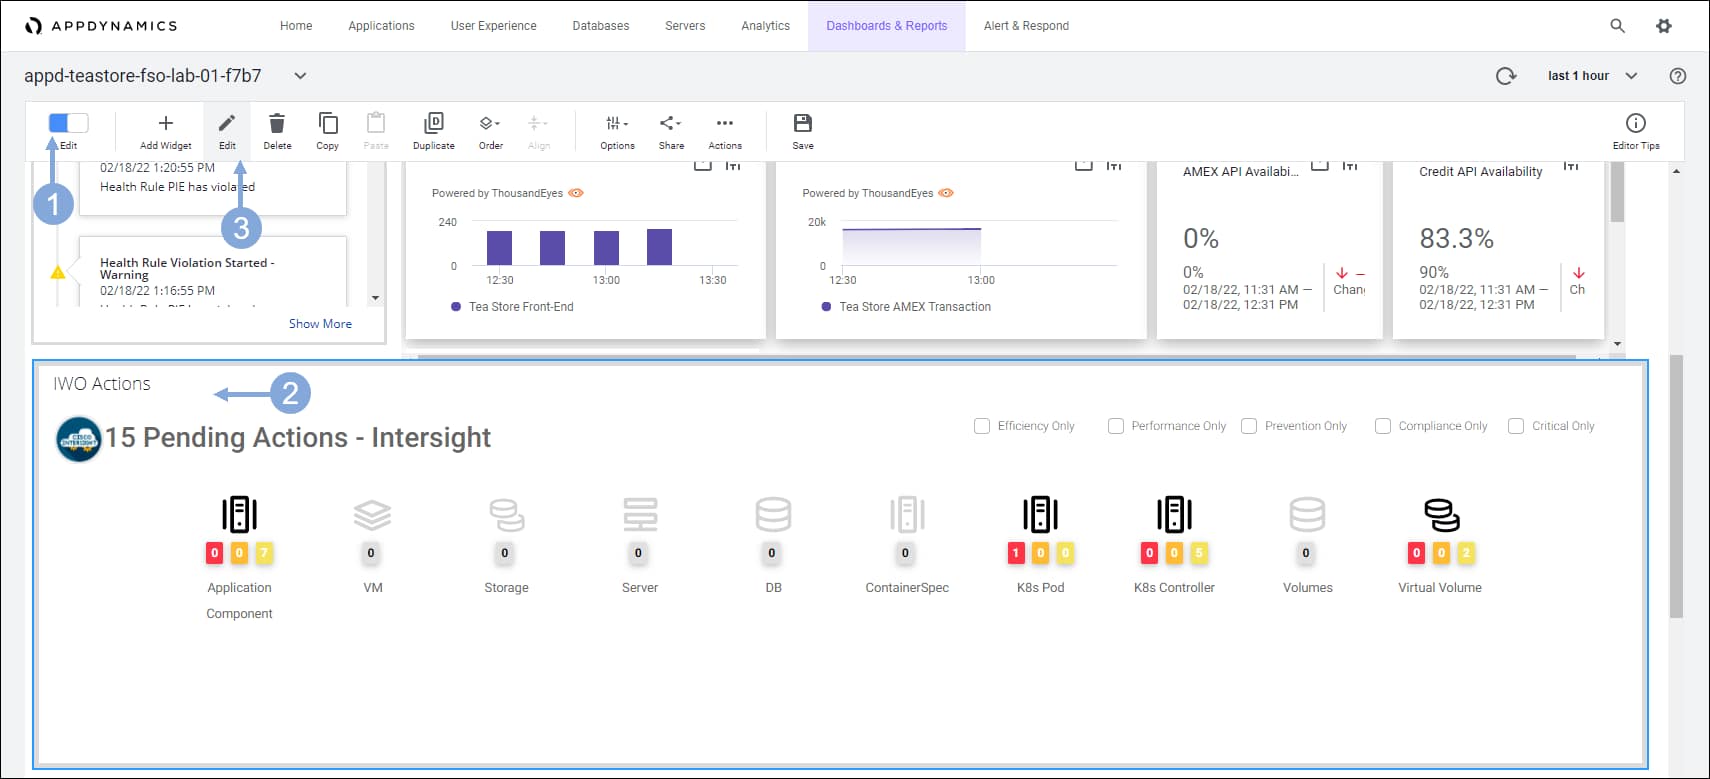
🔵 Use the steps below to update the IFrame Widget URL.
- Paste the URL you constructed in the previous exercise in the ‘URL to display’ field
- Ensure the ‘Security Sandbox iFrame’ checkbox is unchecked
- Click on the ‘Save’ button
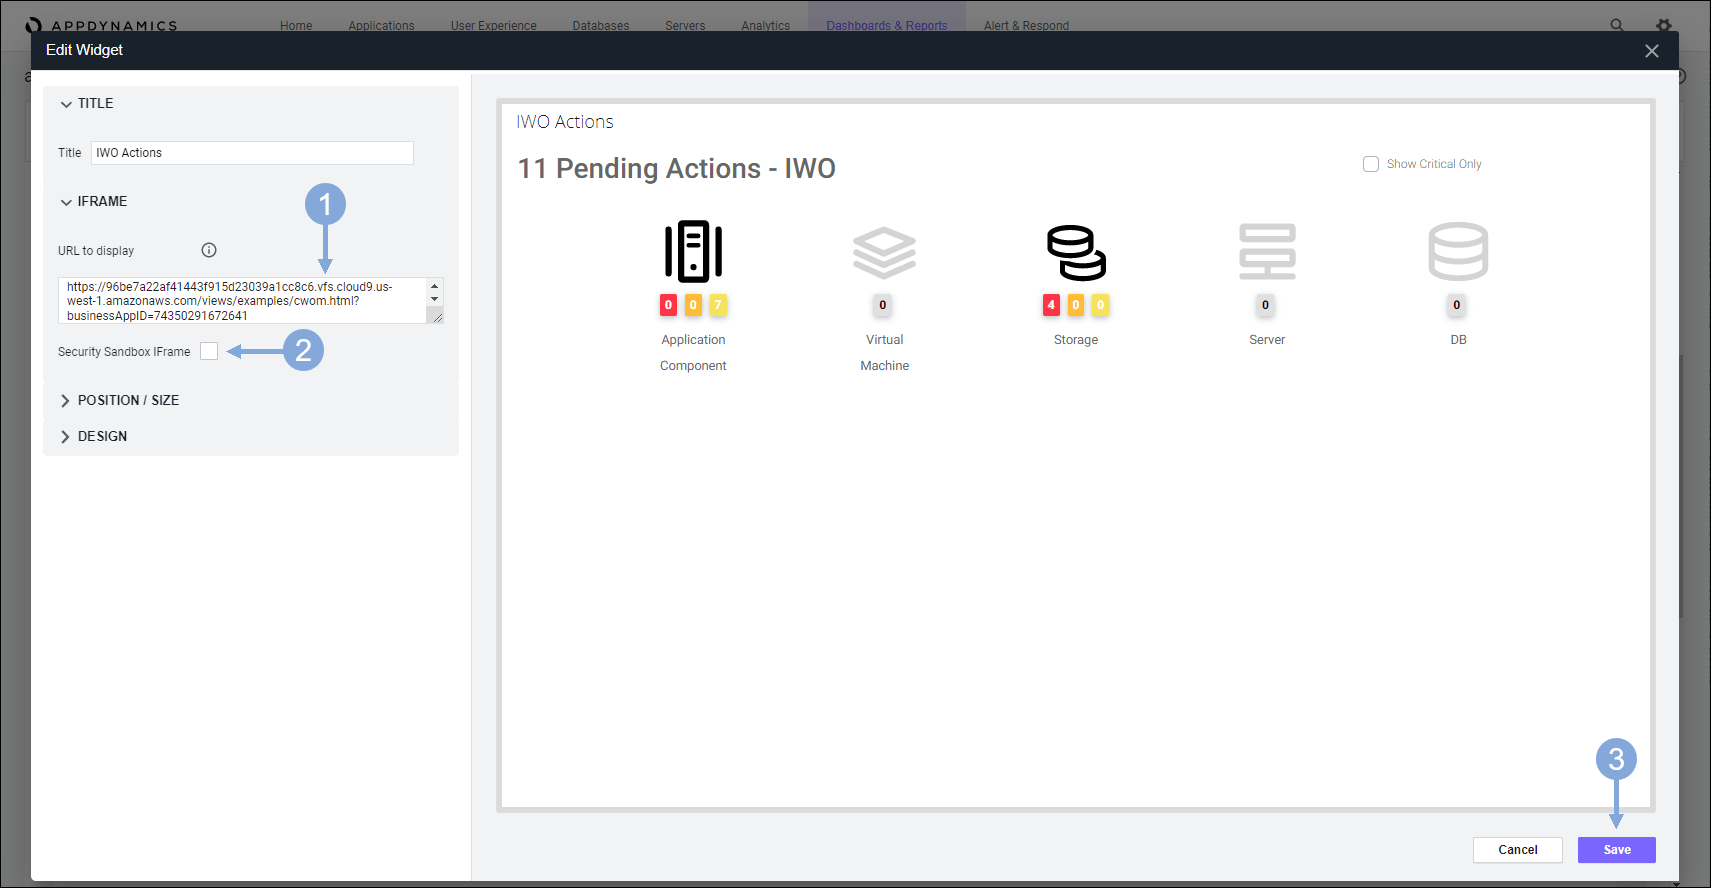
🔵 Now click on the ‘Save’ button to save your changes to the dashboard.

We’ll look at the results of your configuration with specific observability scenarios.
HANDS-ON OBSERVABILITY
In this hands-on session, you’ll see Cisco’s Full-Stack Observability solution in a single dashboard monitoring the TeaStore hybrid application to determine what is affecting the performance to see the impact on revenue. The TeaStore application runs in a Hybrid-Cloud configuration. The application front-end is running in Kubernetes (EKS) in the cloud. The back-end, including the product database, is running on-premises in Kububernetes (IKS).
🔵 Use the credentials used previously to login to the AppDynamics controller if you’ve been logged out.
TeaStore FSO Dashboard
🔵 Open your TeaStore FSO Dashboard using the steps below.
- Click on the ‘Dashboards & Reports’ tab on the top menu
- Double-click on the dashboard you see in the list (there should be only one)

Business Transaction Health
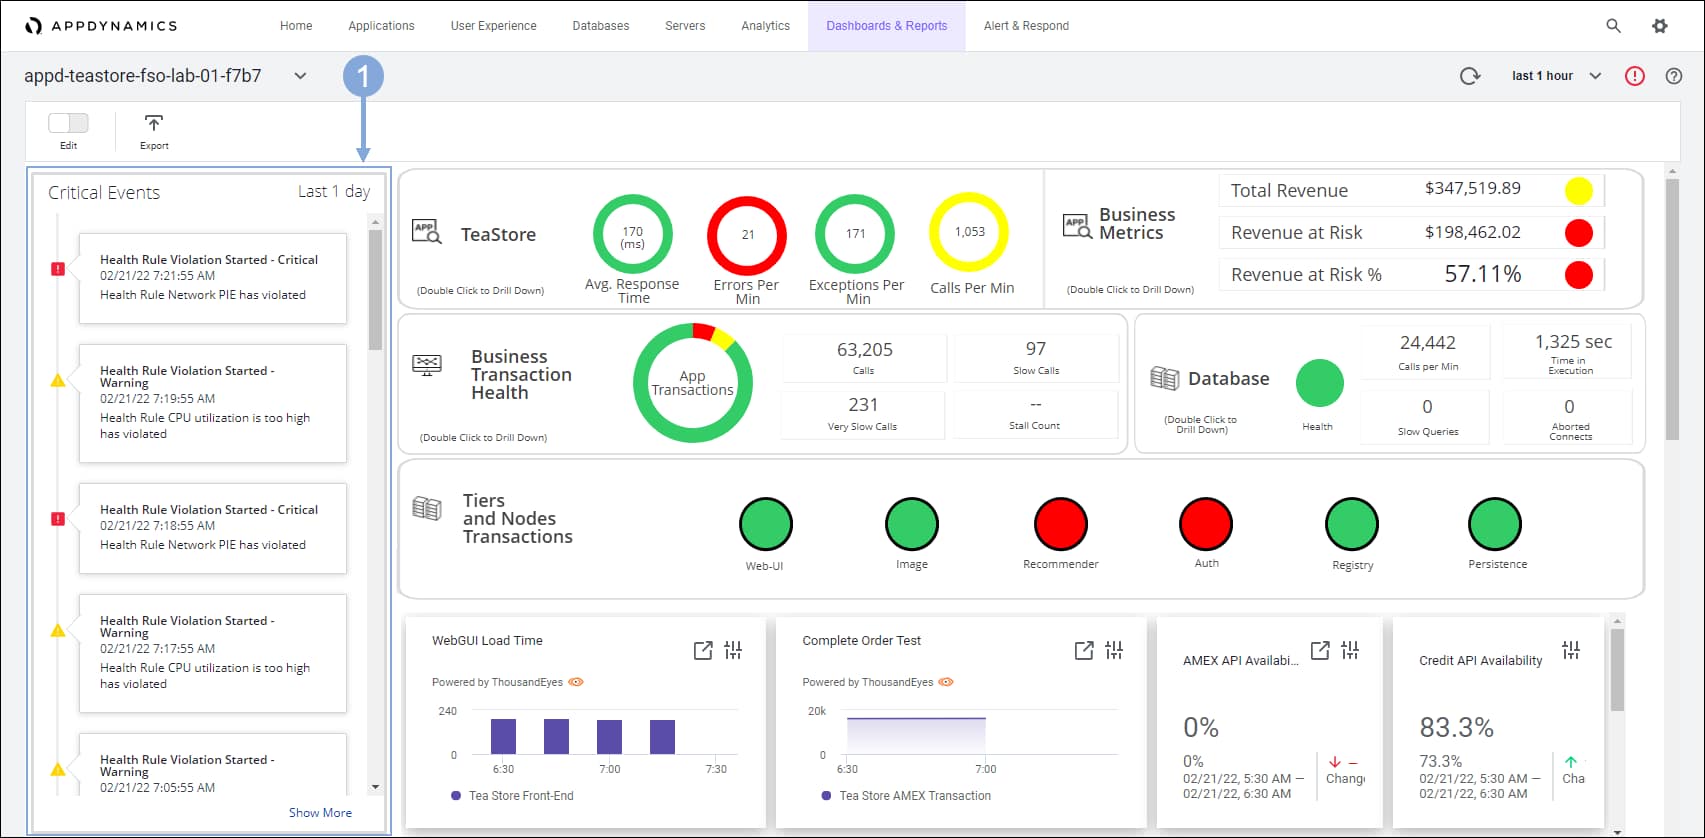
The application dashboard displays. Here in a single view you can see all the important metrics for the application, such as the Business Metrics, Business Transaction Health, Critical Events, and so on.
You can adjust the information presented on the dashboard by changing the Time drop-down at the top right of the dashboard. In this example, note that the displayed data is collated in the past hour.
🔵 Use the step below to explore business transaction health on your modified custom dashboard.
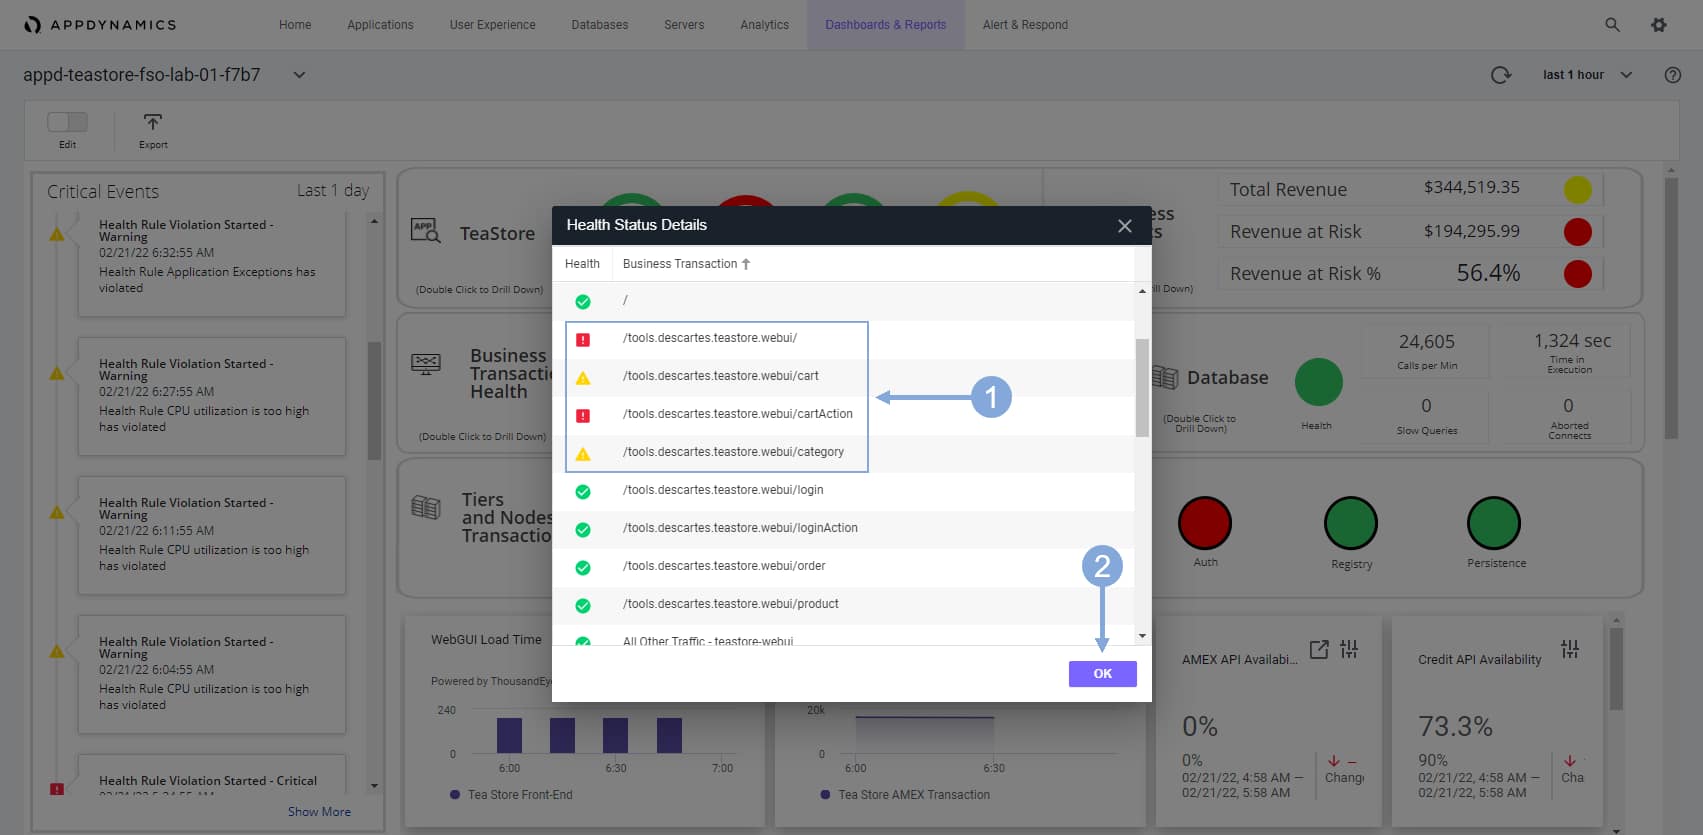
- Double-click on the ‘App Transactions’ pie-chart to display the details of the transactions the end-users took in this time period
🔵 The transactions include logging in, viewing products, adding to the cart, and placing orders.
- Notice that some of the transactions are experiencing difficulties
- Click on the ‘OK’ button when you have reviewed the transactions
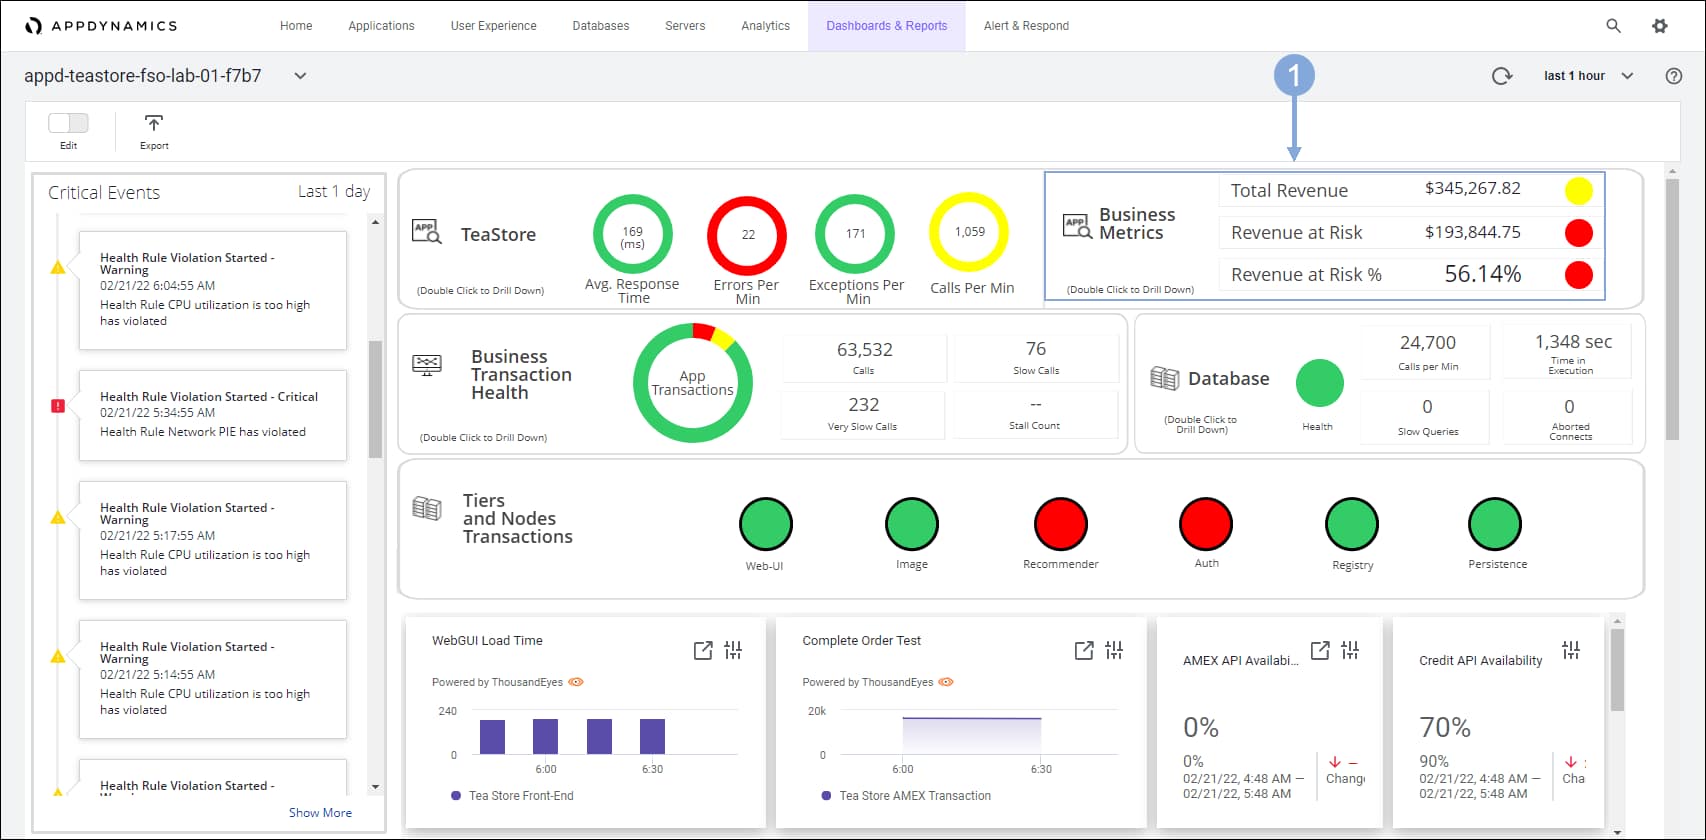
Business Metrics
🔵 Examine the Business Metrics and note how the application performance impacts the revenue.
This area shows the potential revenue, but also indicates how the revenue is impacted by the current performance of the application. The Revenue at Risk % is high compared to the potential revenue, indicating that customers might be frustrated ordering products and might be abandoning orders.
This indicator is a cause for concern and requires further investigation. Before examining what may be causing the issue, you will look at some more details in this dashboard.
Critical Events
🔵 Look at the Critical Events section of the dashboard.
You see that there are some alerts recorded that are impacting the application. You can double-click any of the alerts to see more details about the alert.
Tier and Node Transactions
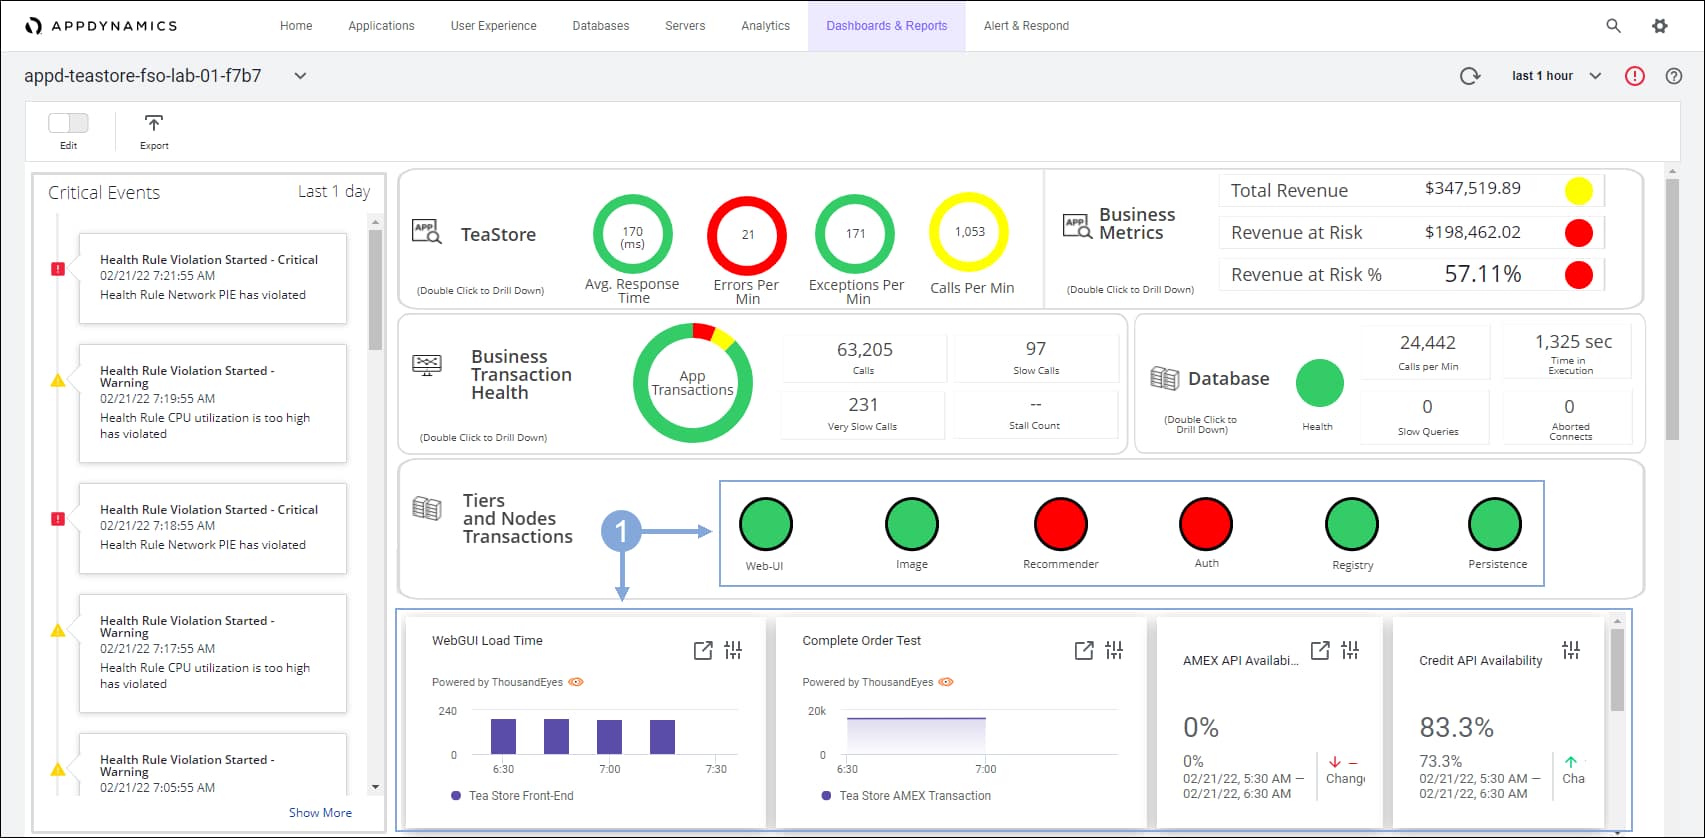
🔵 Scroll to the section below Tiers and Node Transactions to see the key user interactions information.
This information includes how long it takes the application to load for the end-user, what is the average time to place an order, and what affect any third-party dependencies that are processing credit card payments have on the overall application performance. This information is pulled in from tests performed by ThousandEyes.
IWO Pending Actions
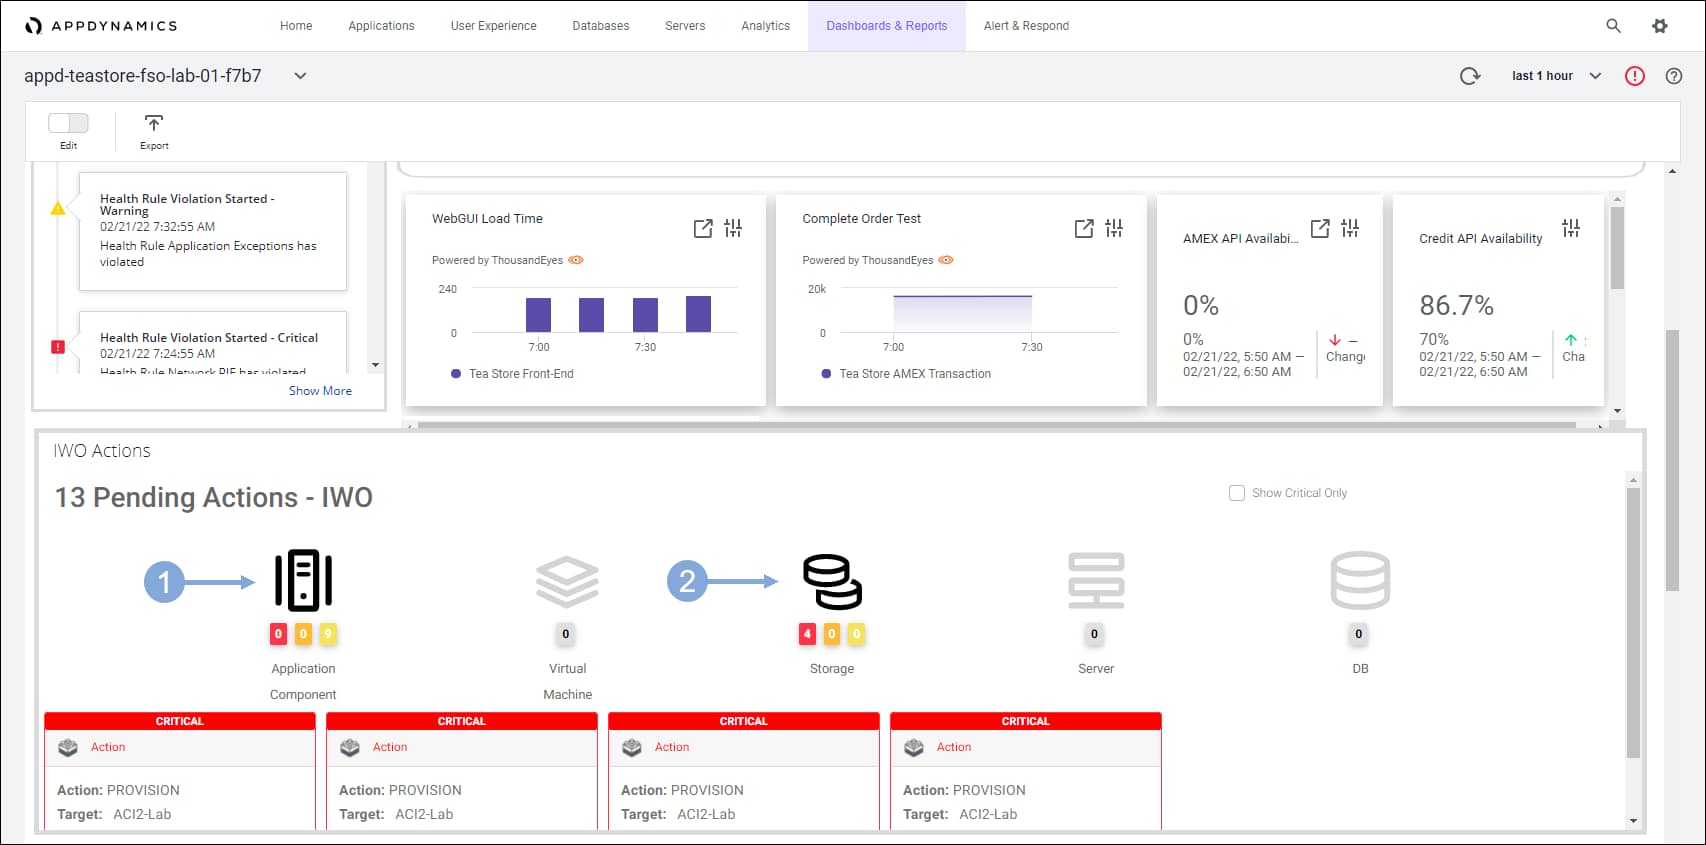
🔵 Scroll to the Pending Actions – IWO section.
These are recommendations to improve the performance or efficiency of the infrastructure that supports the application pulled in from Intersight Workload Optimizer.
🔵 If your dashboard is not showing the IWO components, go to your Cloud9 terminal and restart the IWO Action Integration application using the commands below.
cd /home/ec2-user/iwo-action-integration
npm start
🔵 Use the steps below to explore the IWO pending actions on the dashboard.
- Click on the first component that shows pending actions to see the details of the recommended actions
- Click on the second component that shows pending actions to see the details of the recommended actions
🔵 Next, you will take a look at the application components and their health.
Application Dashboard
🔵Use the steps below to navigate to your TeaStore application.
- Click on the ‘Applications’ tab on the top menu
- Find your TeaStore application with your lab number in the name and click on its name to open it

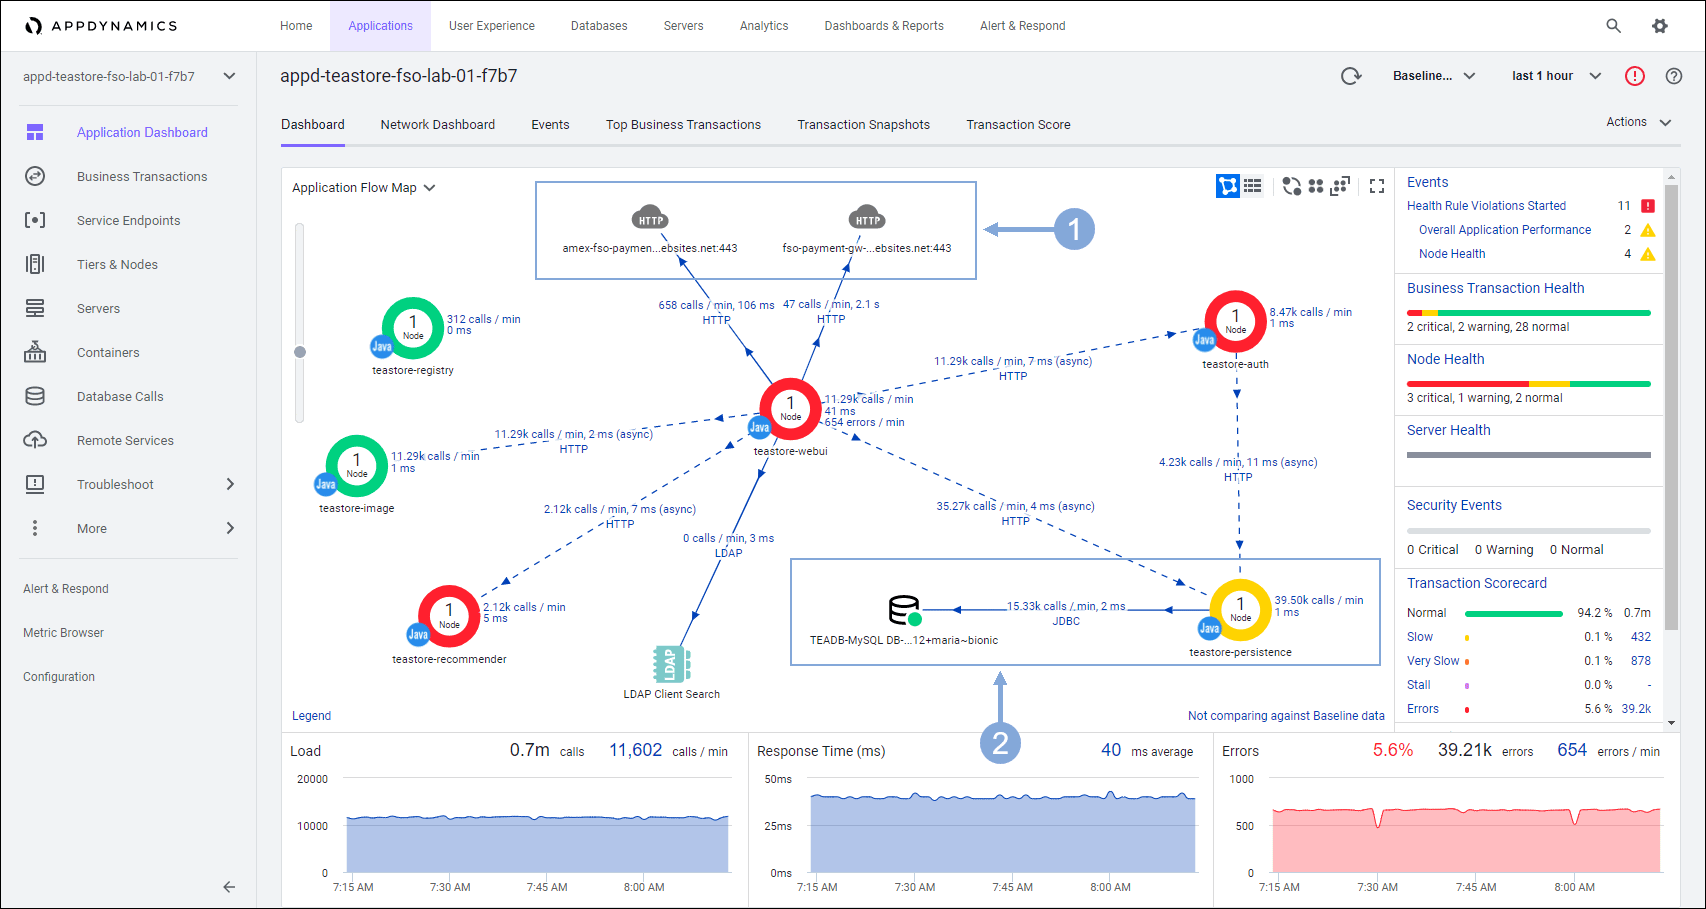
🔵 The Application Dashboard displays showing the components that comprise the TeaStore application.
- The highlighted nodes at the top of the flow map are the third-party applications that process the payments
- The highlighted nodes at the bottom are the on-premises portions of the infrastructure
IWO Optimize Overview


- From the pull-down menu, select “Workload Optimizer“.
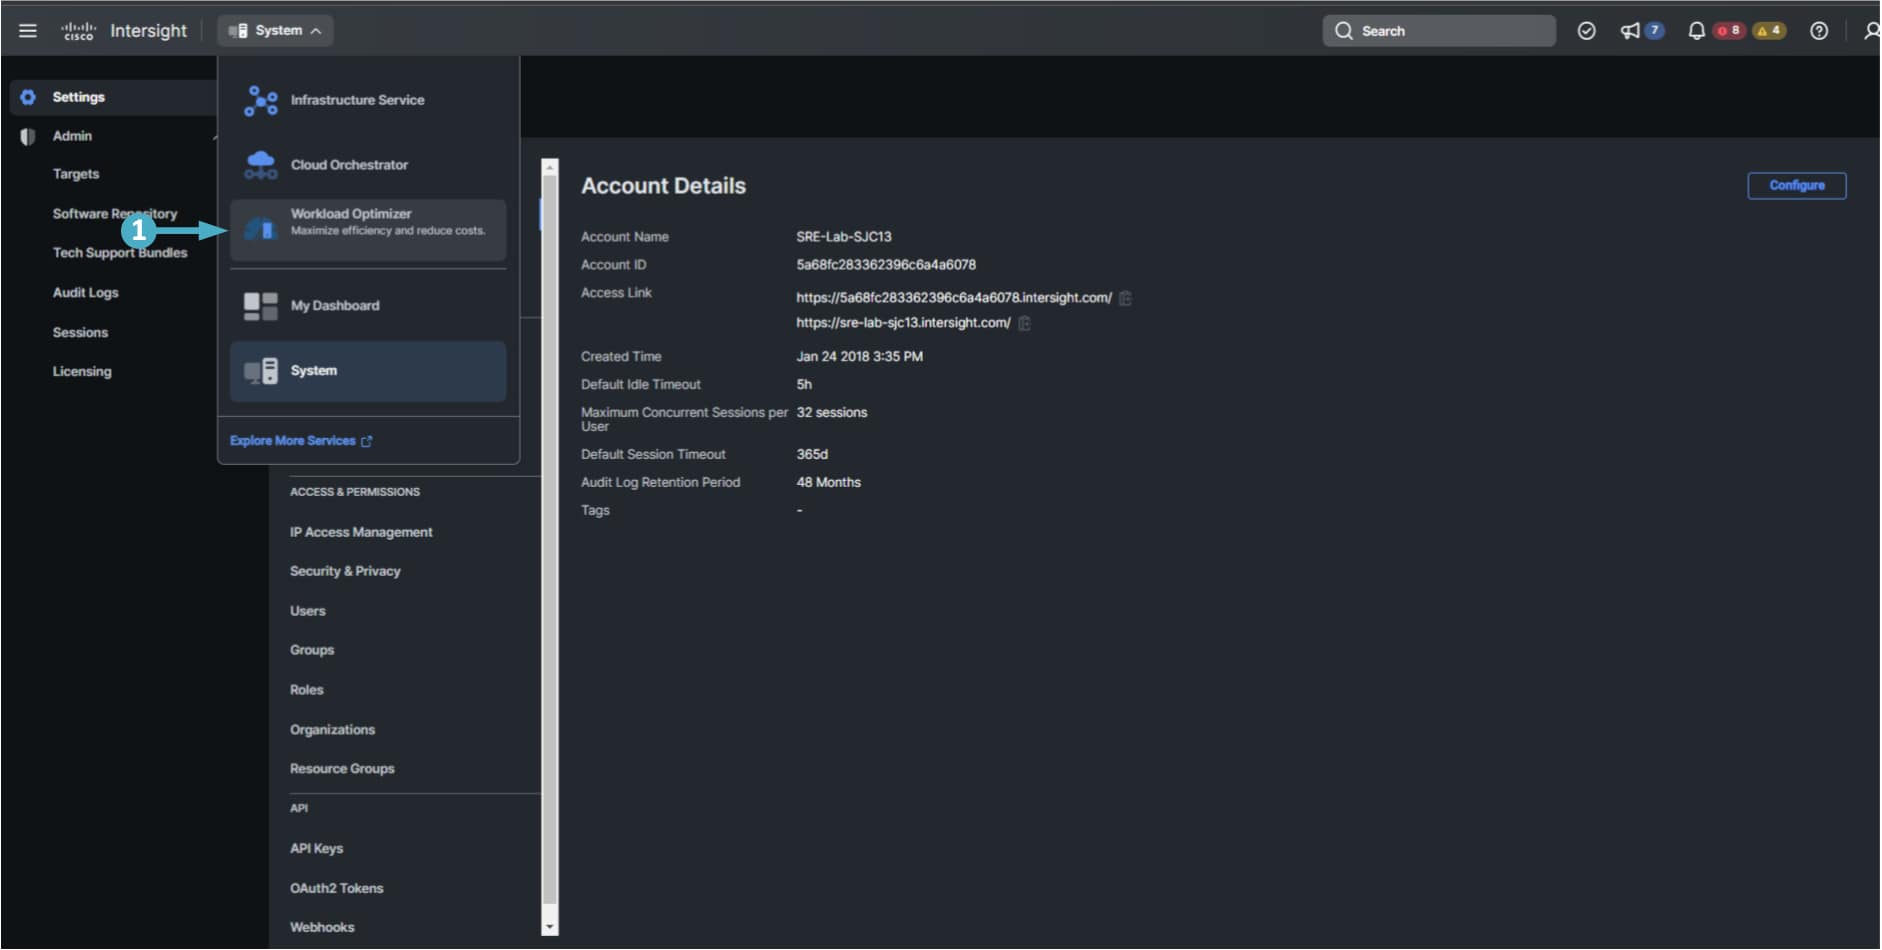
The display shows the Application view of the infrastructure. Multiple applications are visible in this view.
The view presents your environment in the context of Business Applications where you can see the overall health of your applications, examine any performance and compliance risks, and execute the actions that Intersight Workload Optimizer recommends to address these risks.


🔵 Find your specific Business Application using the steps below.
- Find the Business Application that has your lab number in the name and select it to see the infrastructure relevant to it
- If needed click the ‘Show All’ link to find your Business Application and select it

🔵 Explore the left-hand side of the overview.
This is known as the application Supply Chain and represents the flow of resources from the data center, through the physical tiers of your environment and out to the cloud.
By looking at the Supply Chain, you can see:
- How many entities you have on each tier. Each entry in the supply chain gives a count of entities for the given type.
- The overall health of entities in each tier. The ring for each entry indicates the percentage of pending actions for that tier in the data center. Ring colors indicate how critical the actions are. Green shows the percentage of entities that have no actions pending. To get actual counts of pending actions, hover on a ring to more details.
- The flow of resources between tiers. The arrow from one entry to another indicates the flow of resources. For example, the Virtual Machine entry has arrows to Hosts and to Storage. If the VMs are running in a Virtual Data Center, it will have another arrow to that as well. This means that your VMs consume resources from hosts, storage, and VDCs
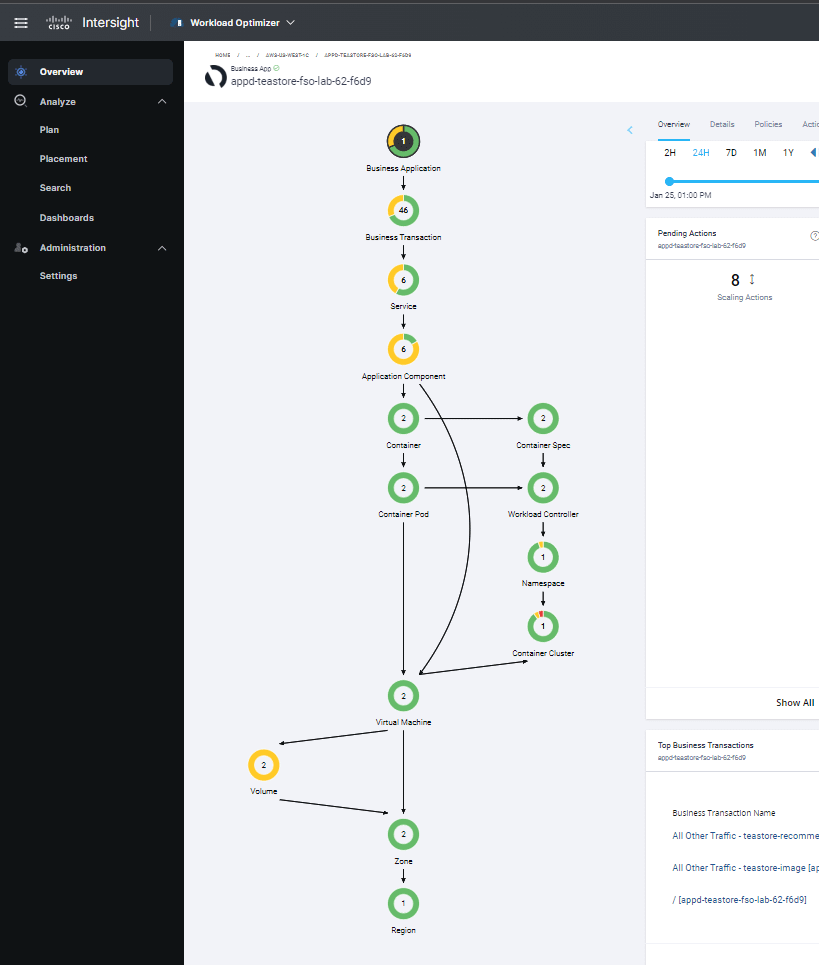
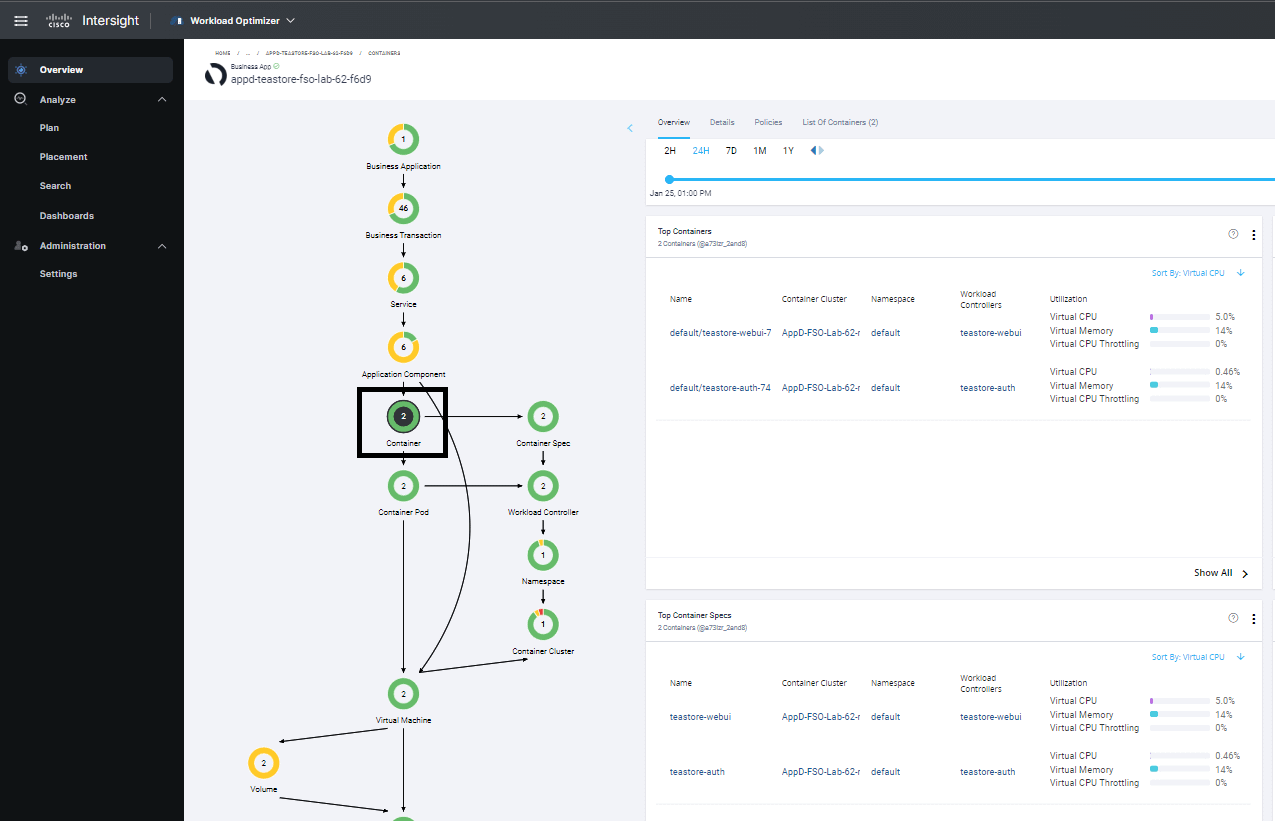
🔵 Scroll down through the Supply Chain then, select the Containers tier.
Here you see a list of all the containers related to the Business Application and the multiple resources they’re utilizing.
🔵 Scroll through the rest of the Supply Chain and review the relationship between the components as desired.
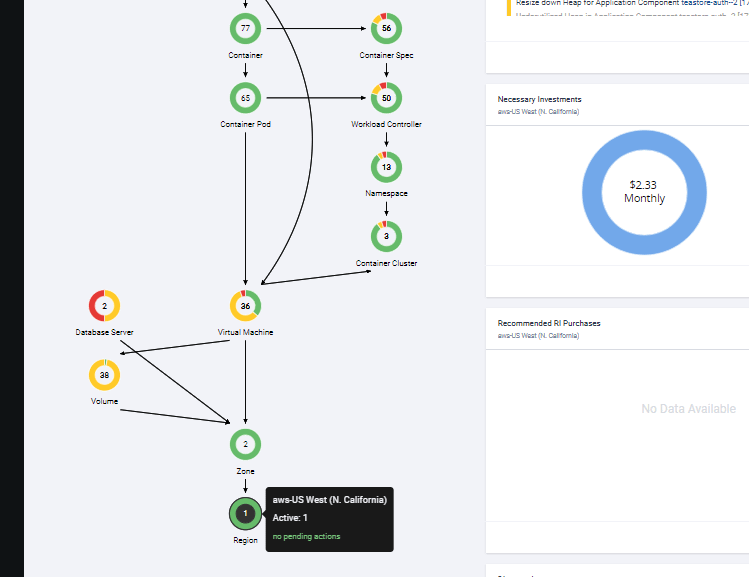
We’ll look at how AppDynamics provides visibility into the infrastructure inter-dependencies with Cloud Native Application Monitoring.
CLOUD NATIVE APP
MONITORING
The Digital Transformation of Bridge-To-Posibili-Tea’s application has moved Antonia and her team to use cloud infrastructure extensively. Today, her organization uses Kubernetes (both on-prem DC and in the Cloud) because it decouples developers and operations from deploying to specific machines and it significantly simplifies day-to-day operations by abstracting the underlying infrastructure.

Antonia and her team are looking for a solution that monitors events and metrics of Kubernetes clusters. It must also track the state of most Kubernetes resources: pods, replica sets, deployments, services, persistent volumes, nodes etc. on both on-prem and in the Cloud.
The ideal solution would be the one with a dashboard that provides an overview of potential issues with cluster health, grouped by category and severity. It must provide real-time statistics on the state of monitored objects on the cluster, best-practice violations, and missing dependencies.
Antonia wants to work and solve the following pain points:
- Detailed insights into the performance of Hybrid-Cloud application
- Ability to see where across the stack problem is occurring and why
- Need to tie performance back to their business metrics and prioritize actions based on business impact
- Be alerted if there are issues that are impacting the business performance of the application
- Visibility into resource utilization by cluster and see the status and the utilization of every pod
- To quickly find what is running in the cluster from a namespace perspective and if any jobs have failed
- See the events that are contributing to problems with the application related to the pods
Next we’ll walk through some hands-on exercises to see how AppDynamics provides deep visibility into Kubernetes clusters.
HANDS-ON OBSERVABILITY
In Kubernetes, containerized applications are deployed on pods, which are dynamically created on virtual groups or clusters called namespaces. Because Kubernetes decouples developers and operations from deploying to specific machines, it significantly simplifies day-to-day operations by abstracting the underlying infrastructure. However, this results in limited control over which physical machine the pods are deployed to.
You will see how AppDynamics provides visibility into the infrastructure inter-dependencies.
🔵 Use the credentials used previously to login to the AppDynamics controller if you’ve been logged out.
Cluster Agent on IKS

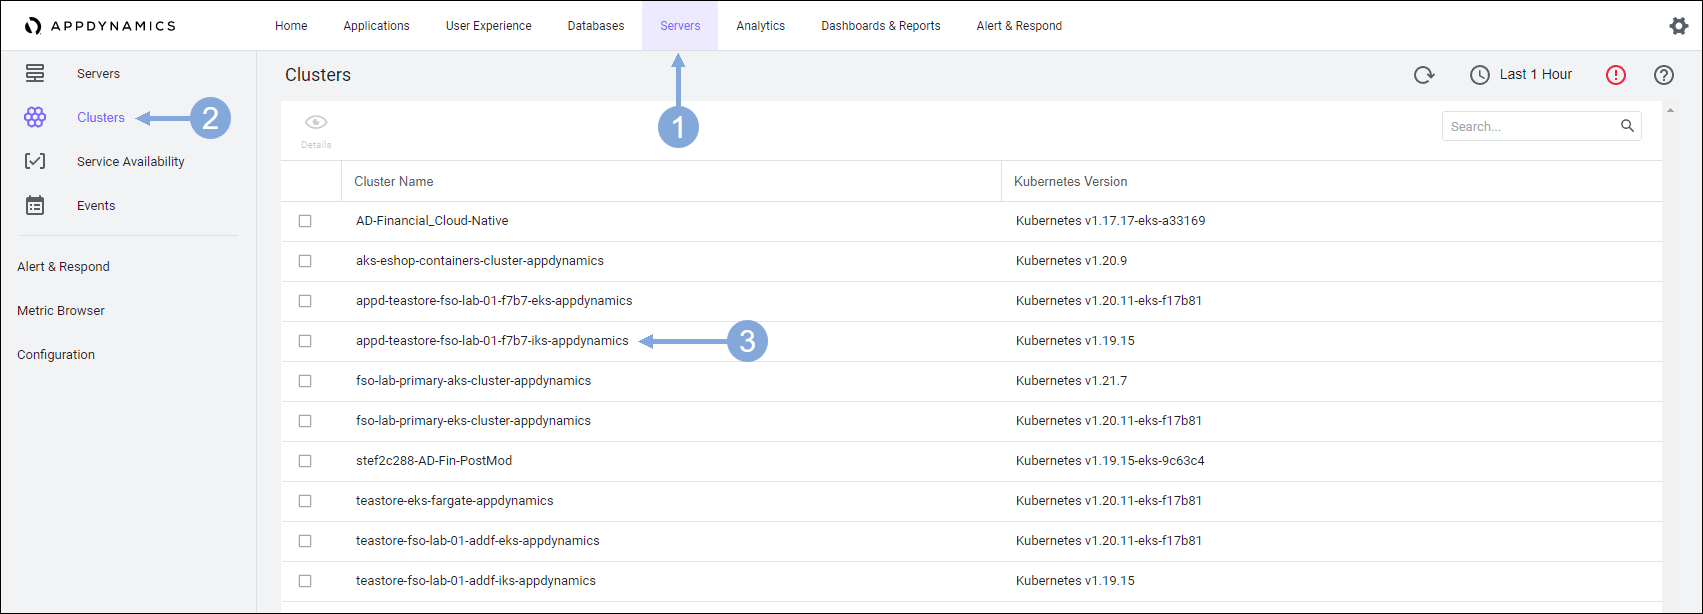
- Click on the ‘Servers’ tab on the top menu
- Click on the ‘Clusters’ menu option on the left
- Find the IKS cluster name that has your lab number teastore-fso-lab-{your-lab-number} and contains iks and double-click on its name ( you can use the search field in the upper right part of the screen if you want).
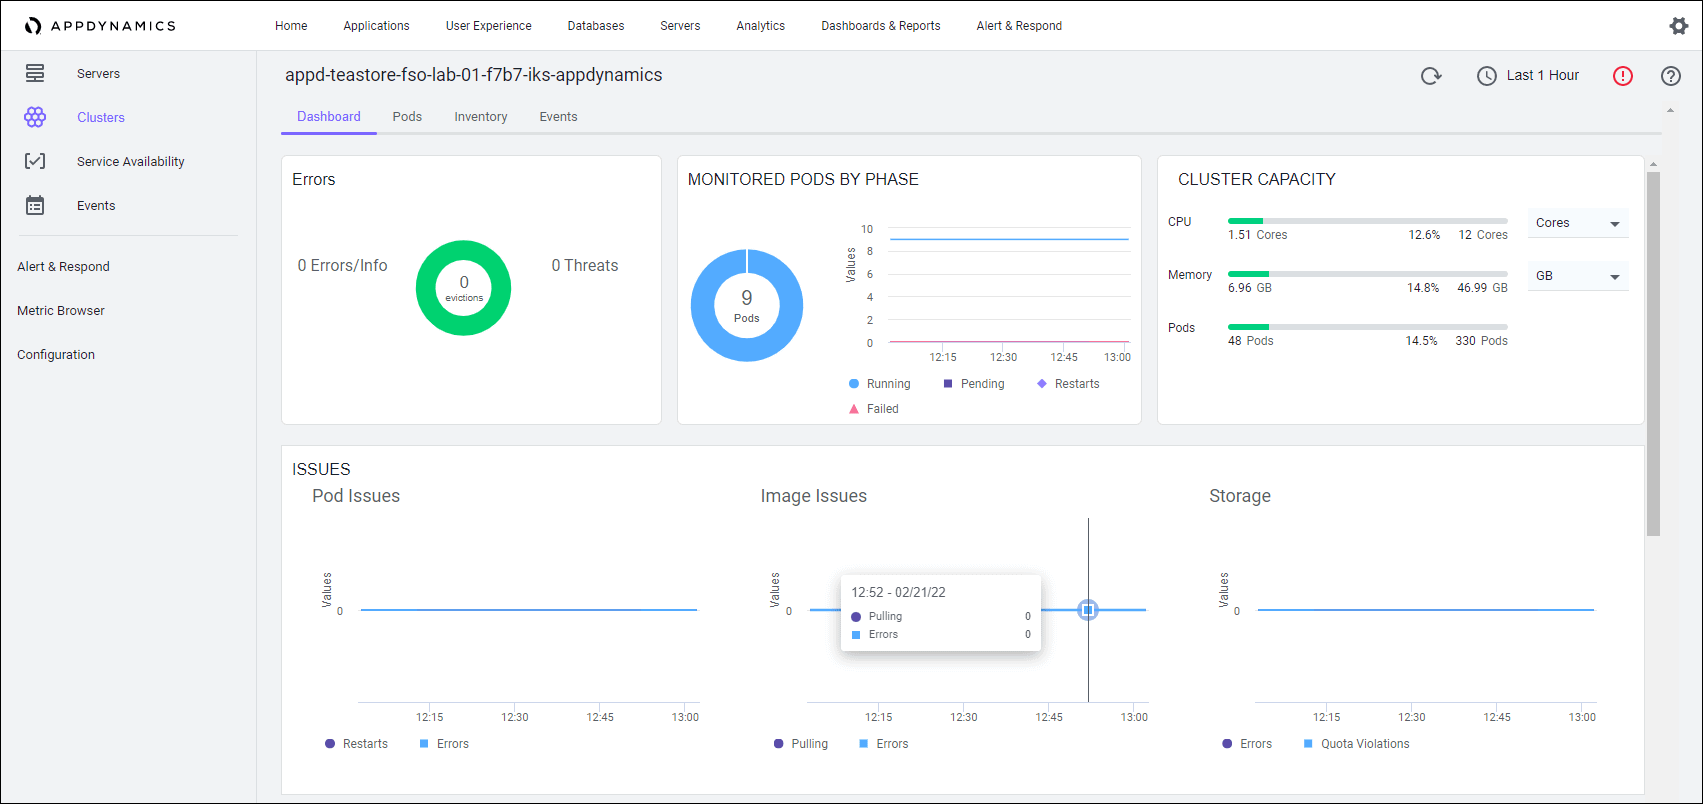
🔵 In the display you can see the following information.
- Cluster capacity by CPU cores, CPU millicores, memory megabyts, or memory gigabytes
- The number of errors that occurred on the cluster
- The number of pods, currently running
- CPU utilization
- Quotas set for memory the utilization compared to the quota

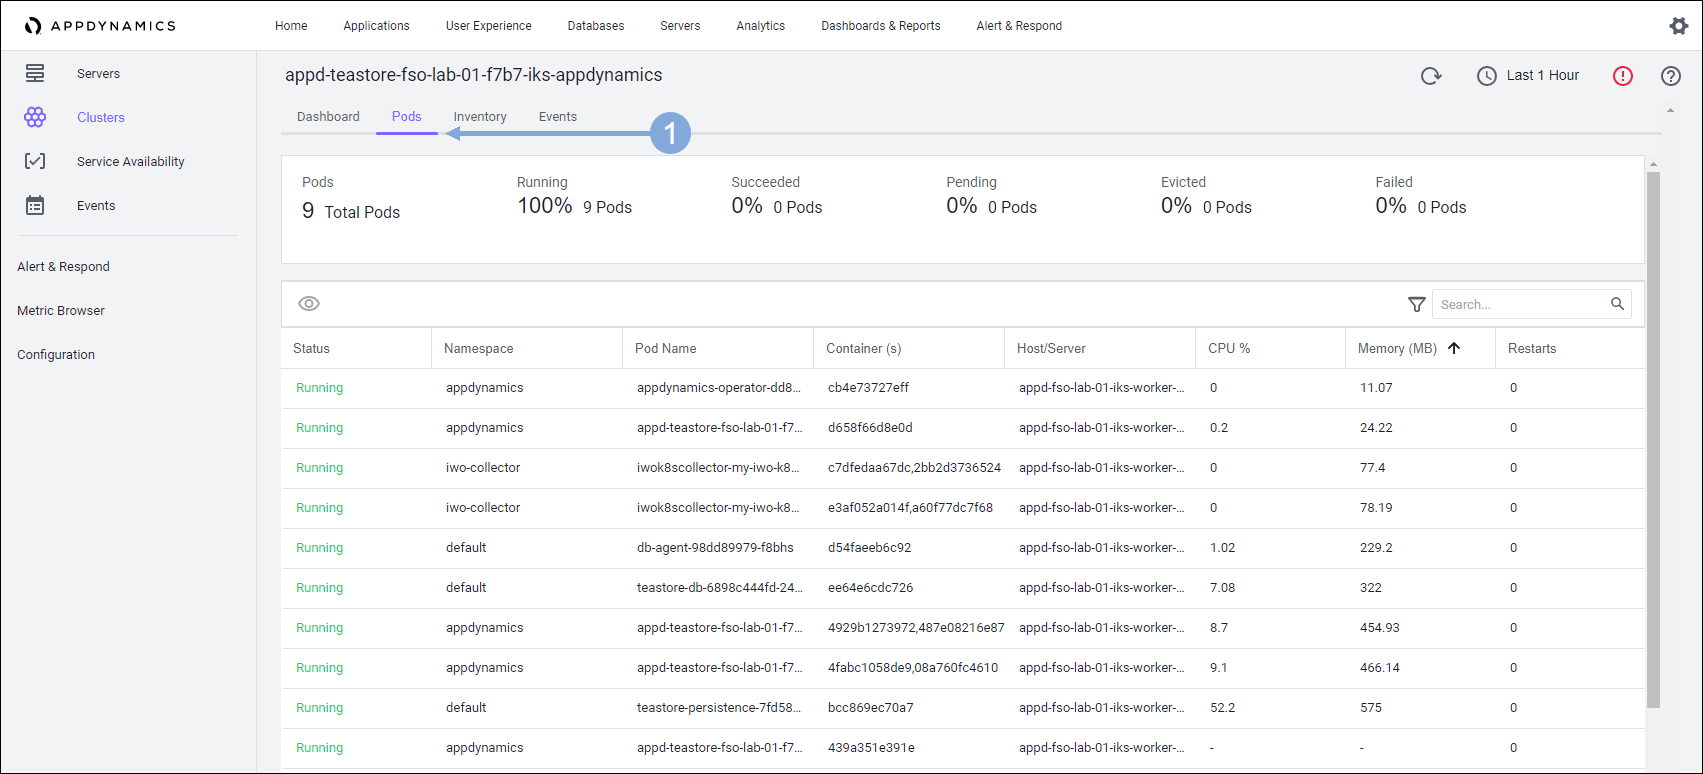
You can see the status of the individual pods. Scrolling down the page, you can see the pod for teastore-persistence. This sortable list, provides information about the pods associated with the application so you can quickly see the status and the utilization of every pod.
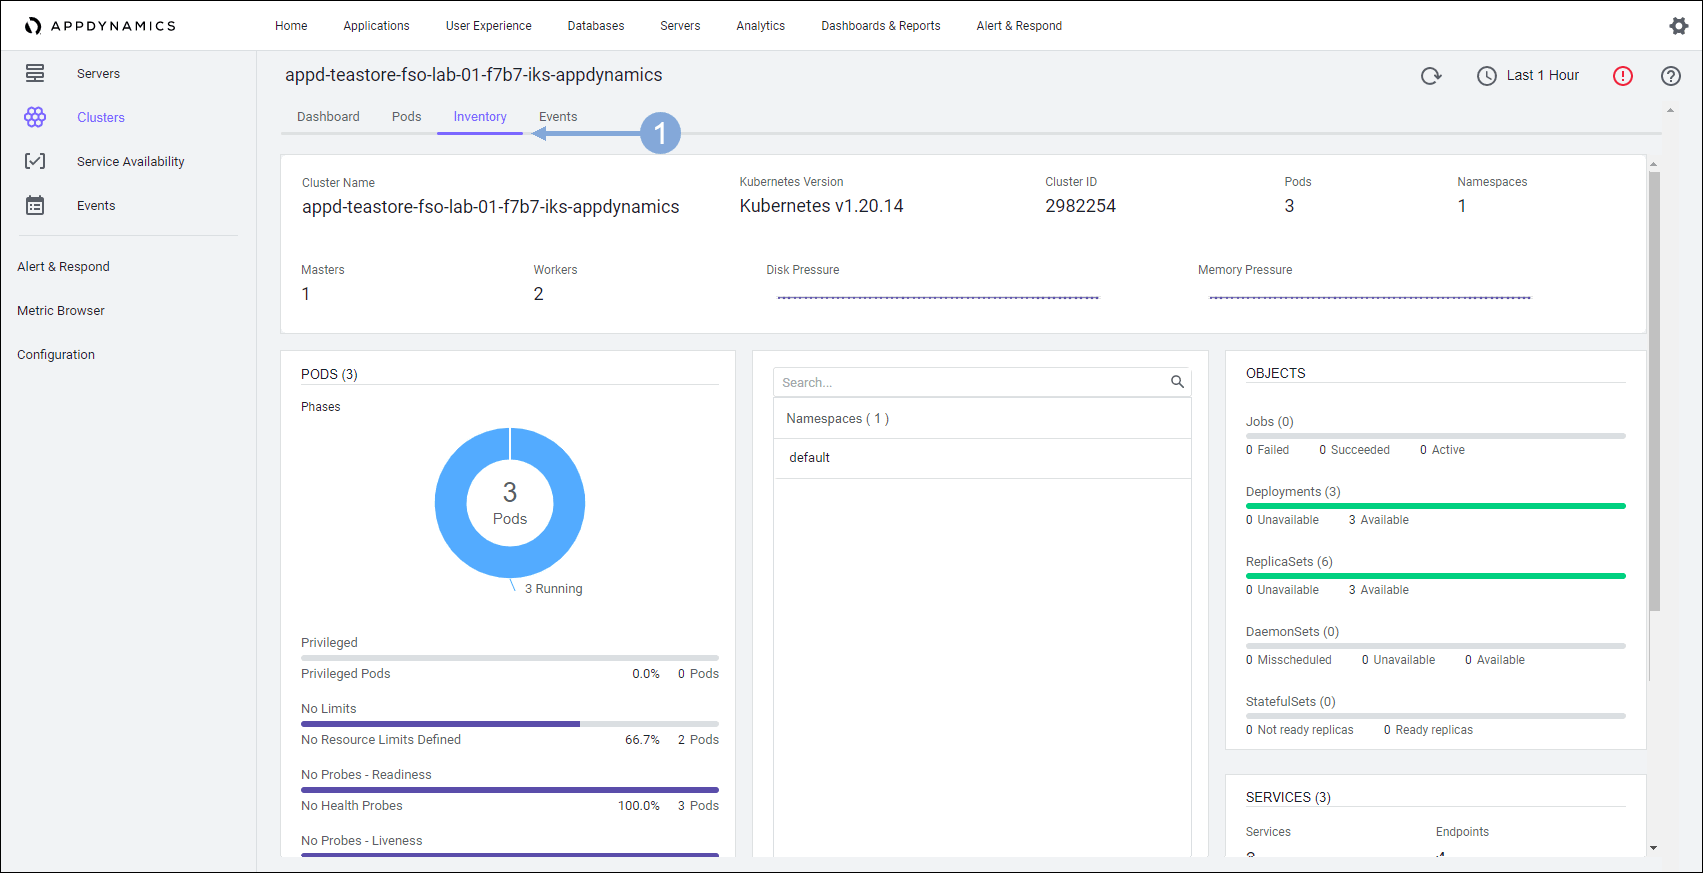
🔵 At the top of the display click Inventory.
You can see what is running in the cluster from a namespace perspective in this display. You will also see whether any jobs have failed, what the deployments look like, and any replicates that exist. At a glance, you see the health of all the components of the cluster.
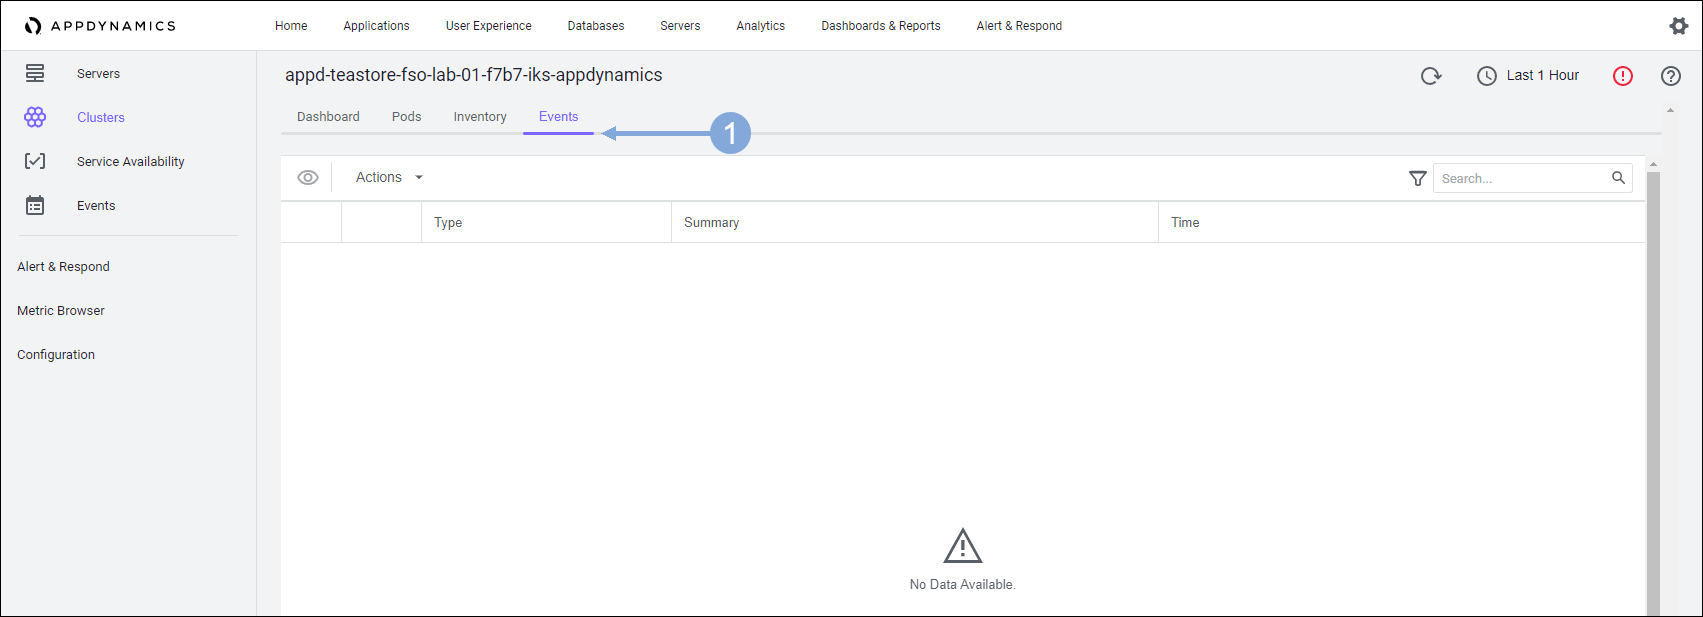
🔵 At the top of the display click Events.
In this case there are no events in the IKS cluster. We’ll look at the EKS cluster next where we’ll see some interesting events.
Cluster Agent on EKS

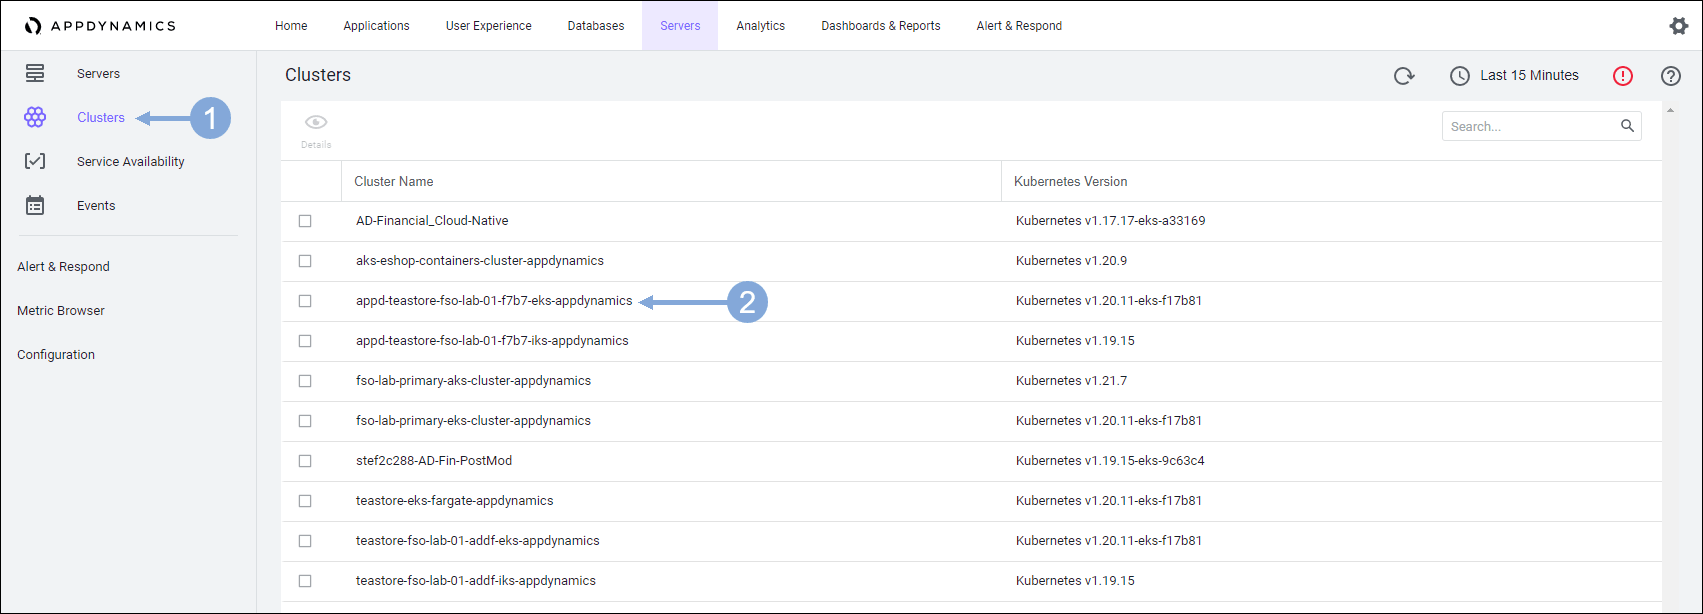
- Click on the ‘Clusters’ menu option on the left
- Find the EKS cluster name that has your lab number teastore-fso-lab-{your-lab-number} and contains eks and double-click on its name
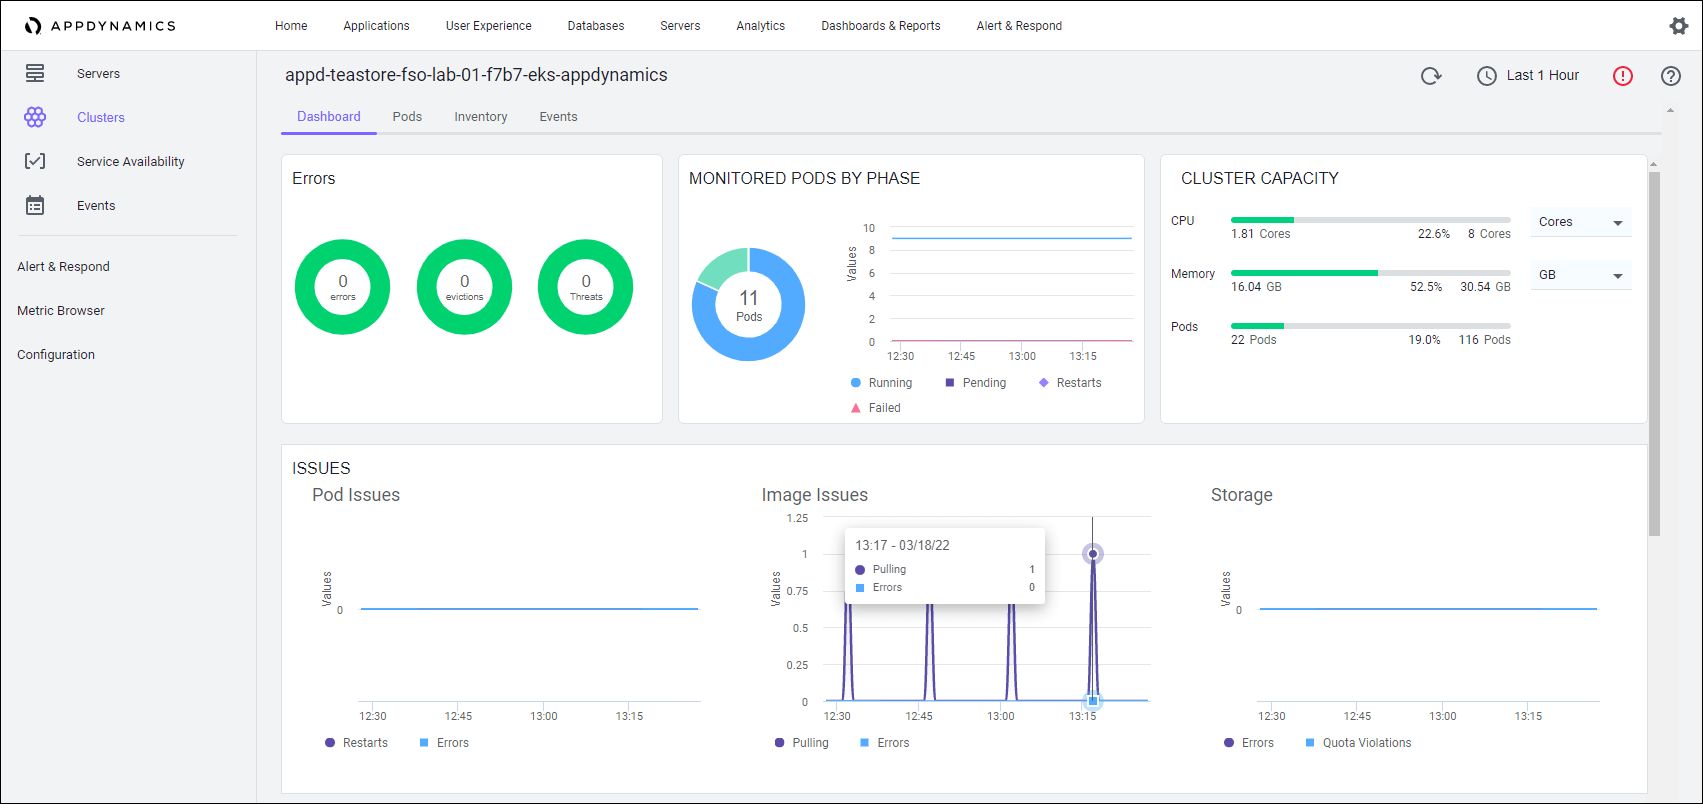
🔵 You get similar information as you did for the on-premise cluster. Notice that there are some errors reported for this cluster.
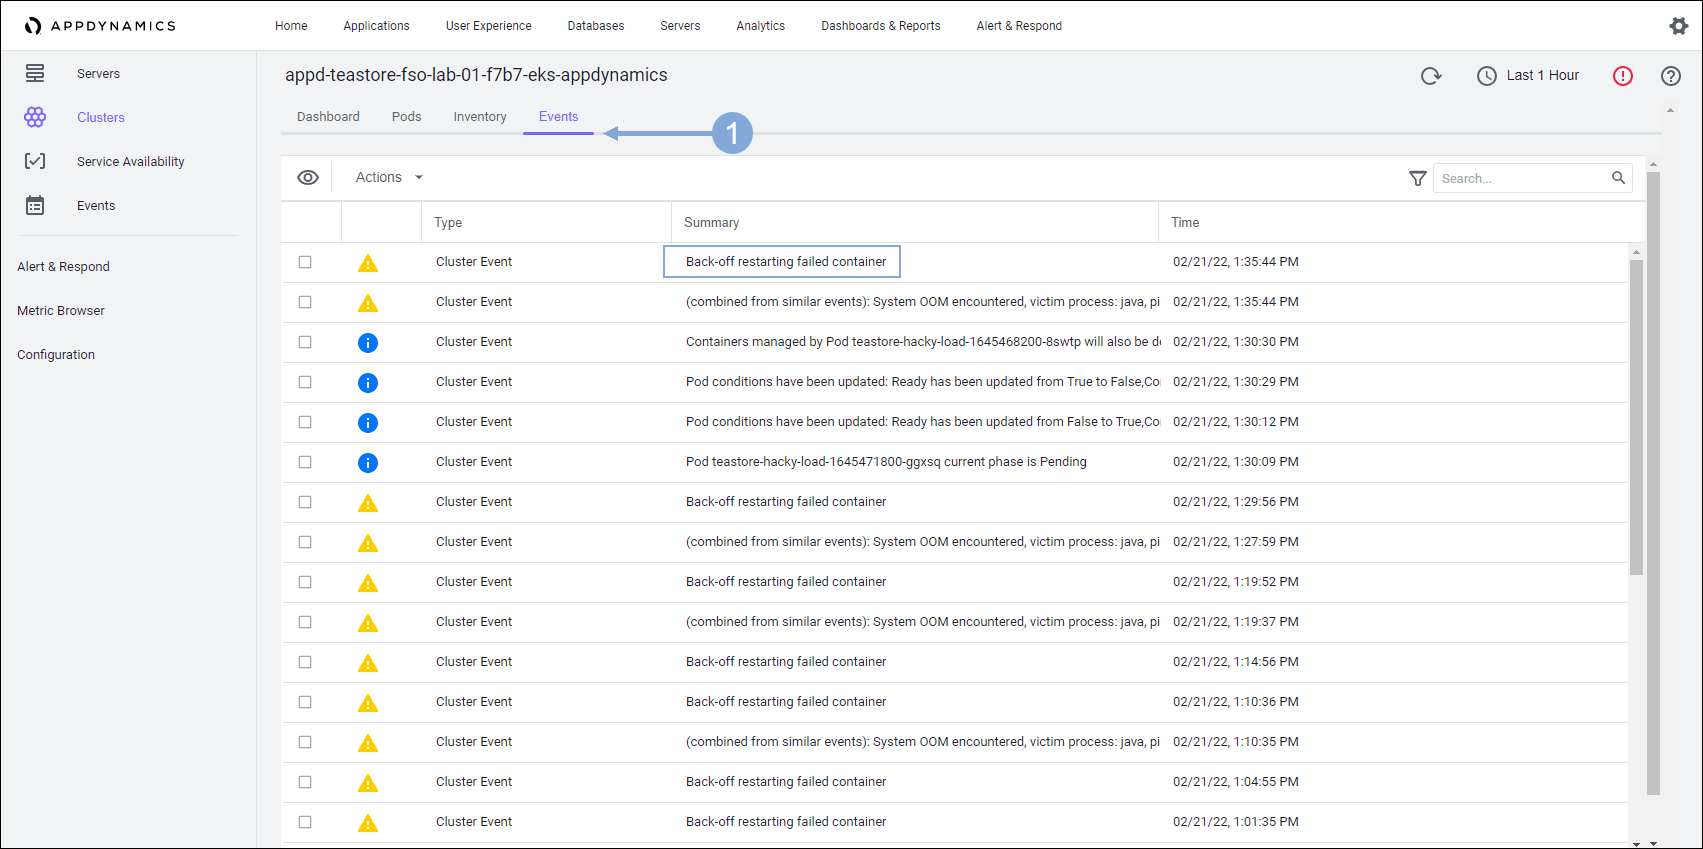
🔵 At the top of the display click Events.
You see the events that are contributing to problems with the application related to the pods. Near the top of the list you see that there is a failed container.

You can see when the event occurred, the cluster name, and which pod is affected. You can see the details of the log from this Cluster Event pop-up.
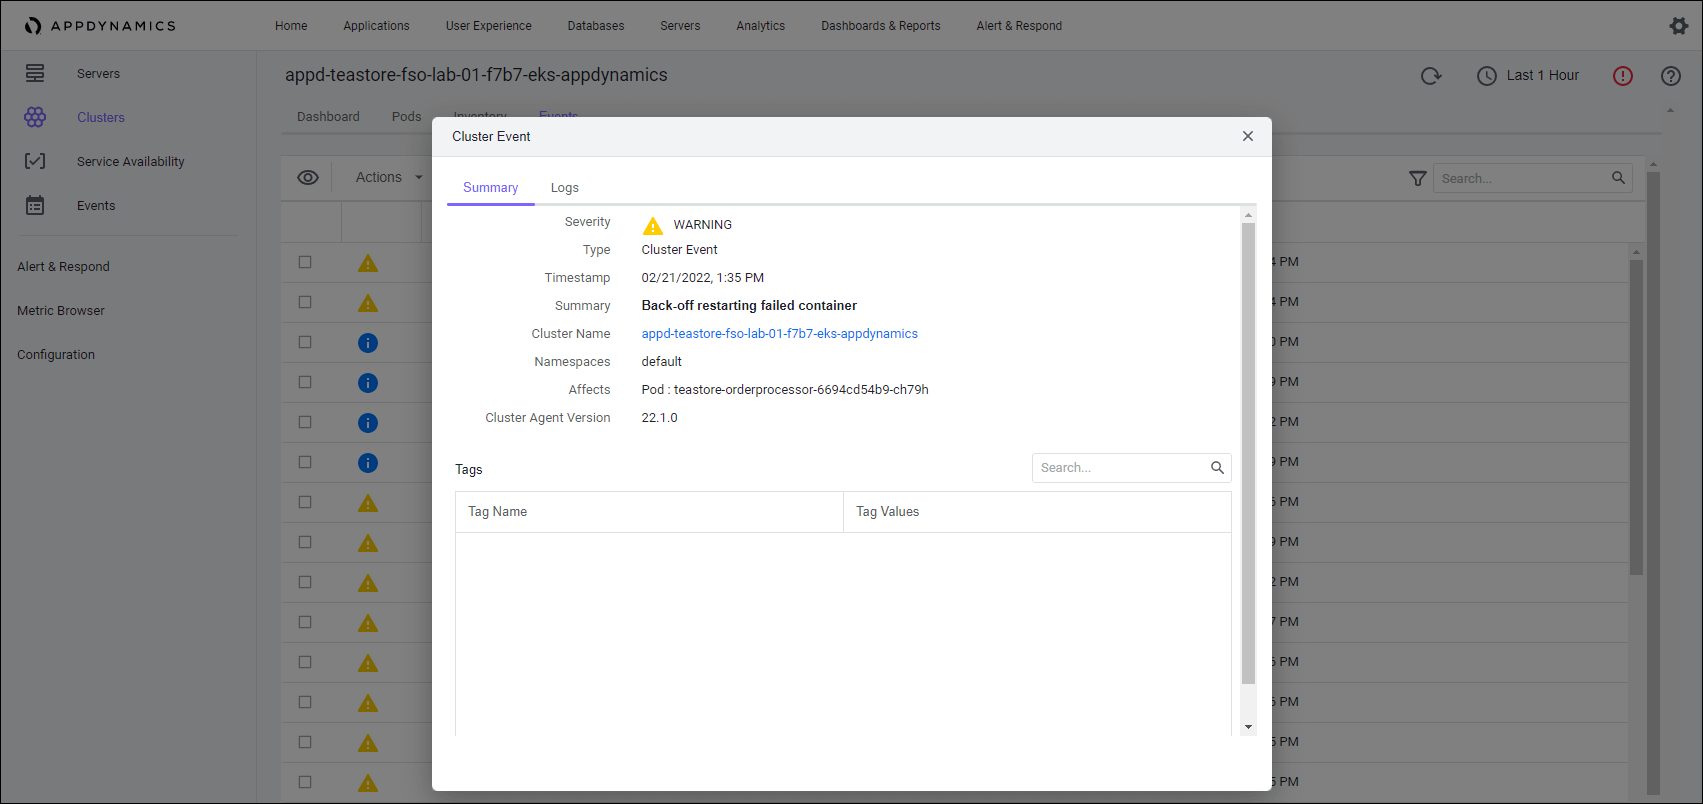
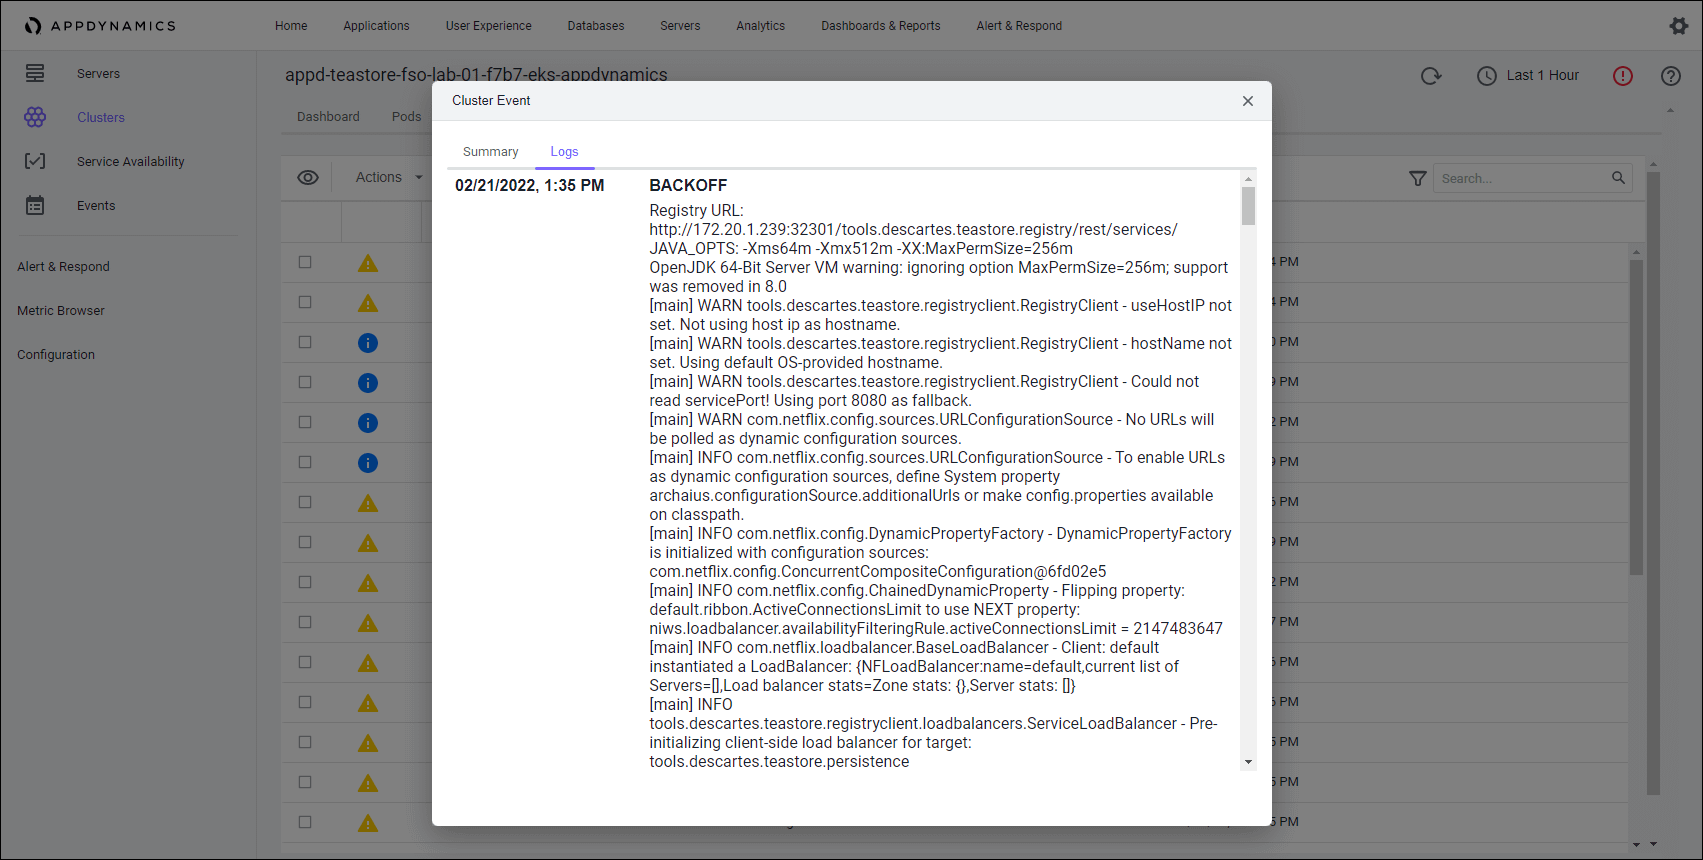
🔵 At the top of the pop-up, click Logs.
The full event log displays in the pop-up for your examination. Based on this information, you can take action to resolve the problem.
Next we’ll look at the integration with ThousandEyes in the Customer Digital Experience Monitoring use case.
DIGITAL EXPERIENCE
MONITORING
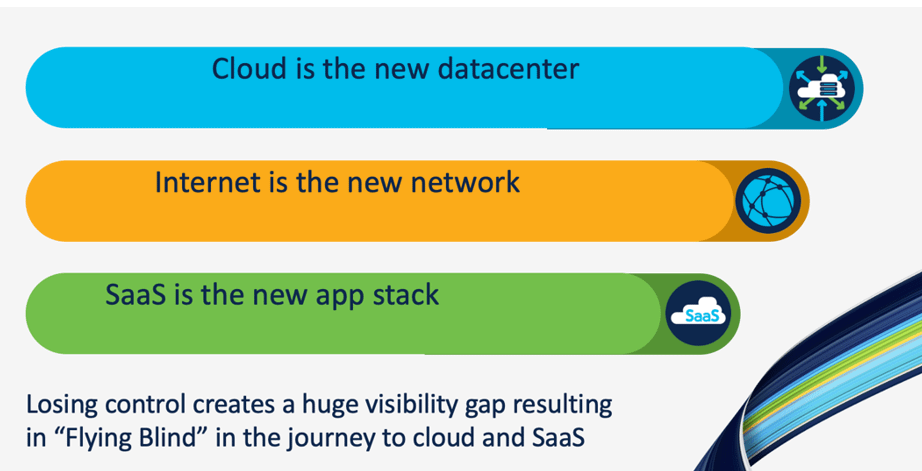
While on a Digital Transformation journey, Erin is also concerned about the experience an end-user has while using the application from anywhere around the globe. She appreciates the importance of global Internet health if her organization wants a highly available network service and optimal digital experience for users.

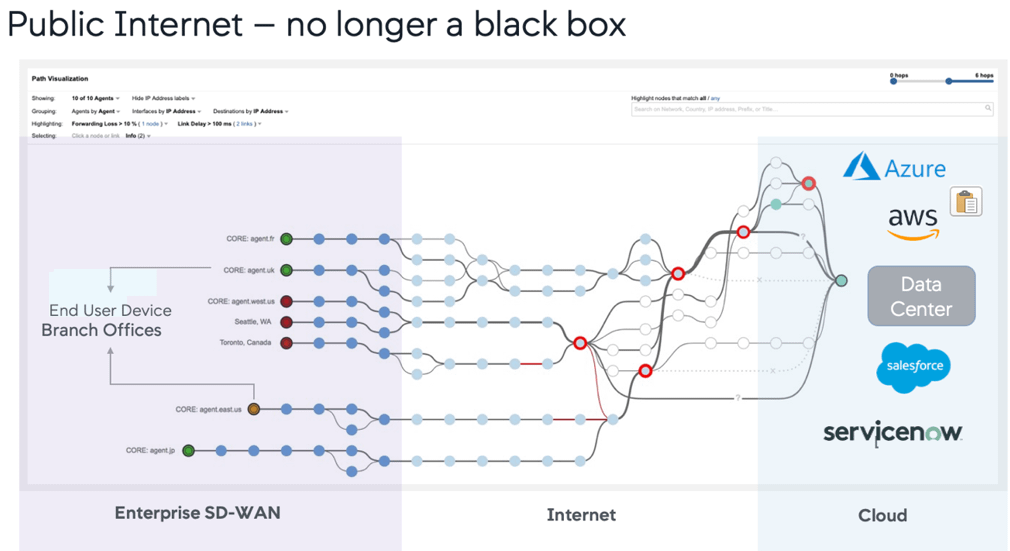
Perceptions of digital experience is becoming mission critical. Because of this, she wants to monitor it to understand and better manage the complex environment. She is looking for a tool that can provide proactive visibility into the delivery of any web application across any network. This tool must provide the cross-layer visibility and synthetics she needs to gain insight into performance and quickly troubleshoot issues from real user vantage points. To understand how external factors affect the web applications, she needs visibility into routing, end-to-end paths, performance (such as latency or loss) and hop-by-hop metrics.
Erin and her team want to work and solve the following pain points:
- Understand and improve application experiences for their customers
- See beyond their organization’s edge and get visibility into networks and external dependencies outside of their control
- Monitor application availability and usability correlated with network connectivity from the perspective of your customers
- Ensure business continuity by proactively monitoring the performance of customer-facing web applications
- Extend RCA (MTTI/MTTR) for network and internet related problems
- Pinpoint issues in real time, dramatically improve MTTR and reduce the business impact of network and application anomalies
- Monitor and troubleshoot connectivity and network performance to IaaS, PaaS services whilst understanding 3rd party service dependencies
Next we’ll walk through the steps to deploy a ThousandEyes agent and create a new test to give us visibility into the network.
HANDS-ON CONFIGURATION
In this section we’ll walk through the following deployment and configuration tasks for ThousandEyes.
- Deploy a ThousandEyes Enterprise Agent in AWS
- Create a ThousandEyes Web HTTP Server Test
- Configure a Dashboard in ThousandEyes
- Install ThousandEyes Browser Agent (Optional)
Deploy ThousandEyes Agent
🔵 Log into ThousandEyes


- Click on the ‘Cloud & Enterprise Agents’ tab to expand the menu on the left
- Click on the ‘Agent Settings’ menu option
- Click on the ‘Add New Enterprise Agent’ button on the right


- Click on ‘IaaS Marketplaces’
- Click on the eyeball icon to display the Account Group Token
- Click on the ‘Copy’ button to copy the Account Group Token and then save it for later
- Click the ‘Launch in AWS’ button (this will open another window with the AWS console login)

🔵 Click on the ‘Next’ button
🔵 Verify the region at the top right of the AWS console has “N.California” selected in the drop-down menu. If not, from the drop-down menu, select “US West (N. California) us-west-1“

🔵 Use the command below in your Cloud9 terminal to obtain the EKS cluster name you’ll need in the next step
echo $aws_eks_cluster_name
The output should look like the image below.


- Enter your EKS cluster name with ‘-stack’ at the end for your stack name
- Paste the Account Token you copied earlier
- Enter your EKS cluster name with ‘-EA’ at the end for your Hostname
- Select ‘FSO-Lab-Dev-Ops’ for your KeyName
- For Subnet ID type your lab # (for example – Lab-01) to filter your subnets and select one of your public subnets
- For VPC type your lab # (for example – Lab-01) to filter your VPC and select your VPC ID
- Click the ‘Next’ button

🔵 Click on the ‘Next’ button

🔵 Click on the ‘Create stack’ button
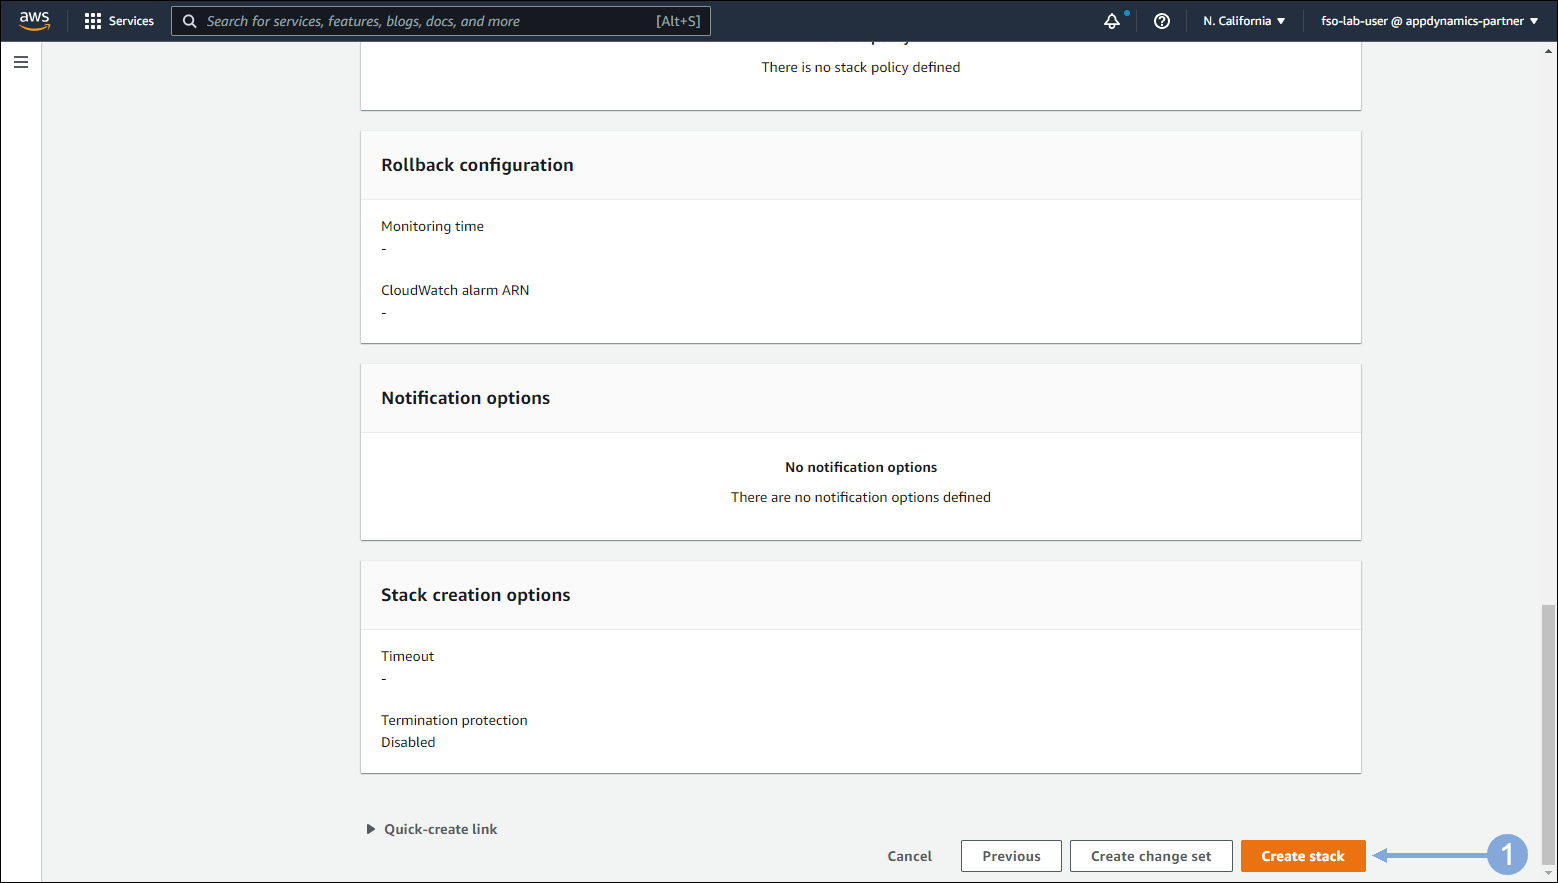

- The stack will take approximately 2-3 minutes to be created
- You can click the refresh button at the top left next to Stacks to see the status
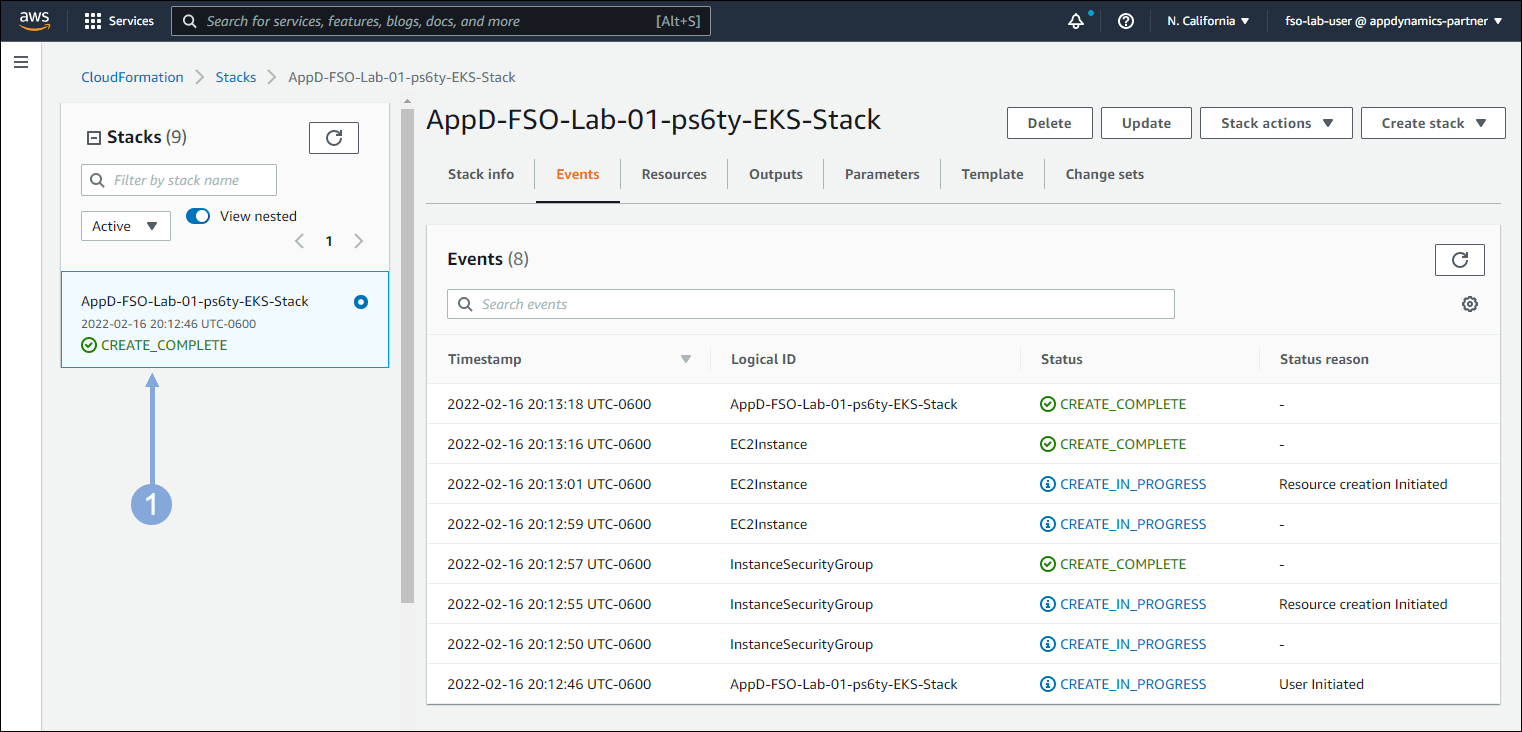
🔵 The agent you just created should appear in the Agent Settings page within about 5 minutes

Create ThousandEyes Test

- Click on the ‘Cloud & Enterprise Agents’ tab to expand the menu on the left
- Click on the ‘Test Settings’ menu option
- Click on the ‘Add New Test’ button

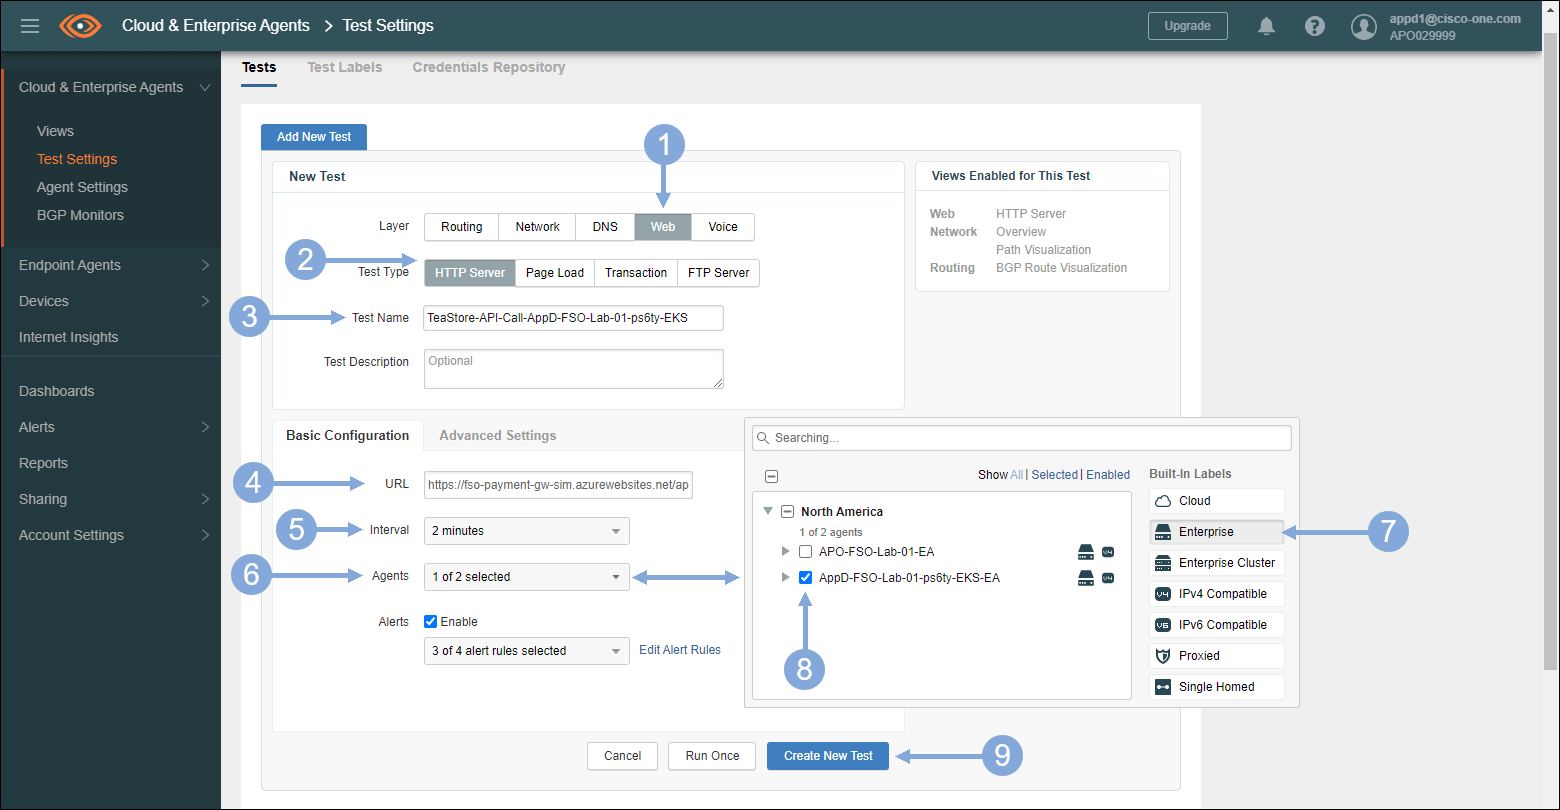
🔵 Use the steps below to configure the new Web HTTP Server test
- The Layer should be ‘Web’
- Test Type should be ‘HTTP Server’
- Test Name should be ‘TeaStore-API-Call-’ followed by your EKS cluster name
- Enter https://fso-payment-gw-sim.azurewebsites.net/api/payment in the URL field
- Interval should be ‘2 minutes’
- Click on the Agents Field
- Select ‘Enterprise’ in the ‘Built-in Labels’ column
- Select your agent you just created
- Click the ‘Create New Test’ button
🔵 Now click on the Web HTTP Server test you just created

🔵 Now click on the ‘Run Once’ button to run the test on-demand
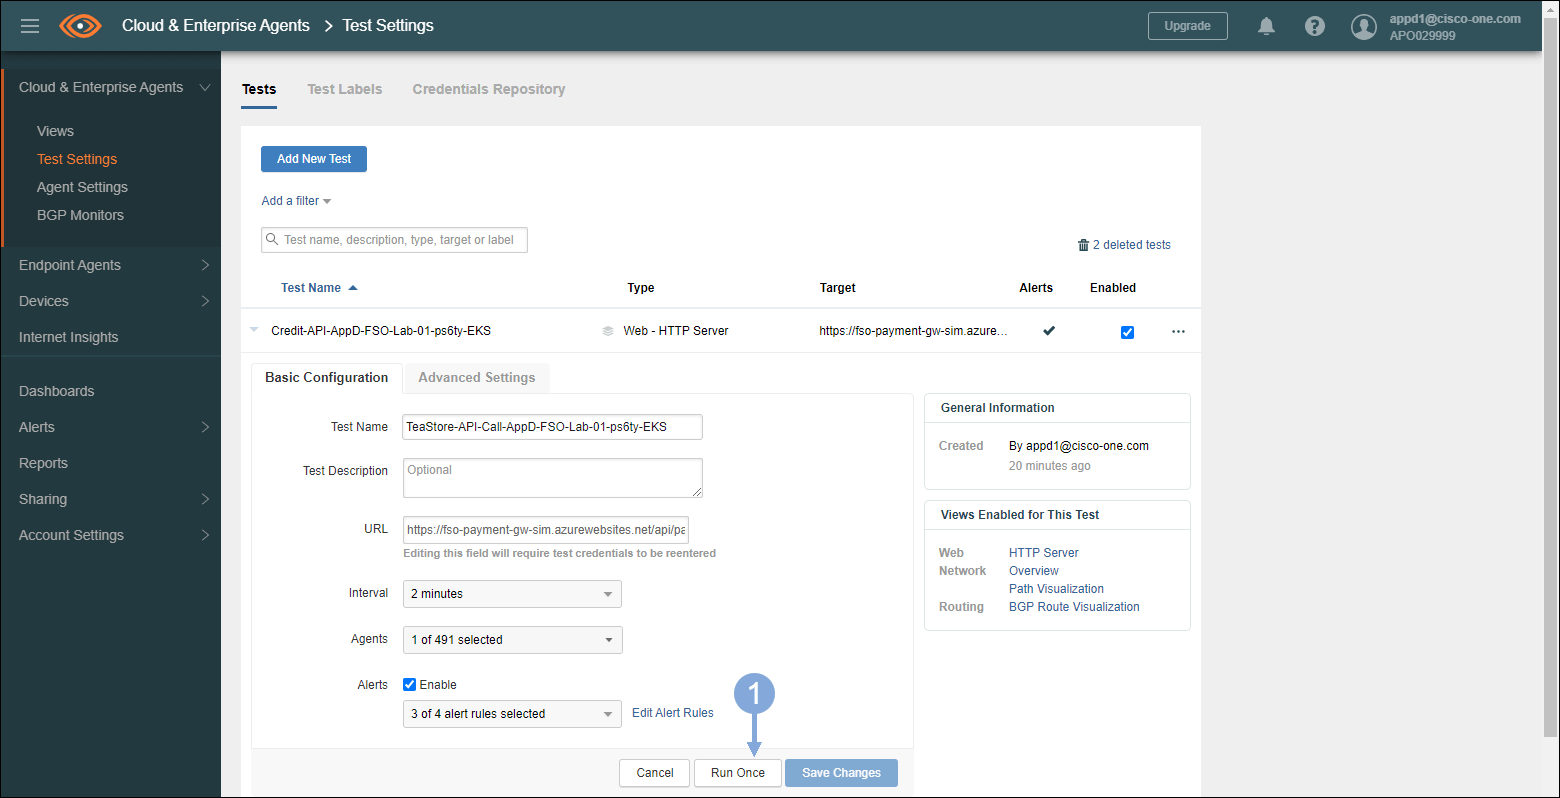
🔵 The test should run and the Views Display should appear after a couple minutes where you can look at the Availability and the Status by Phase
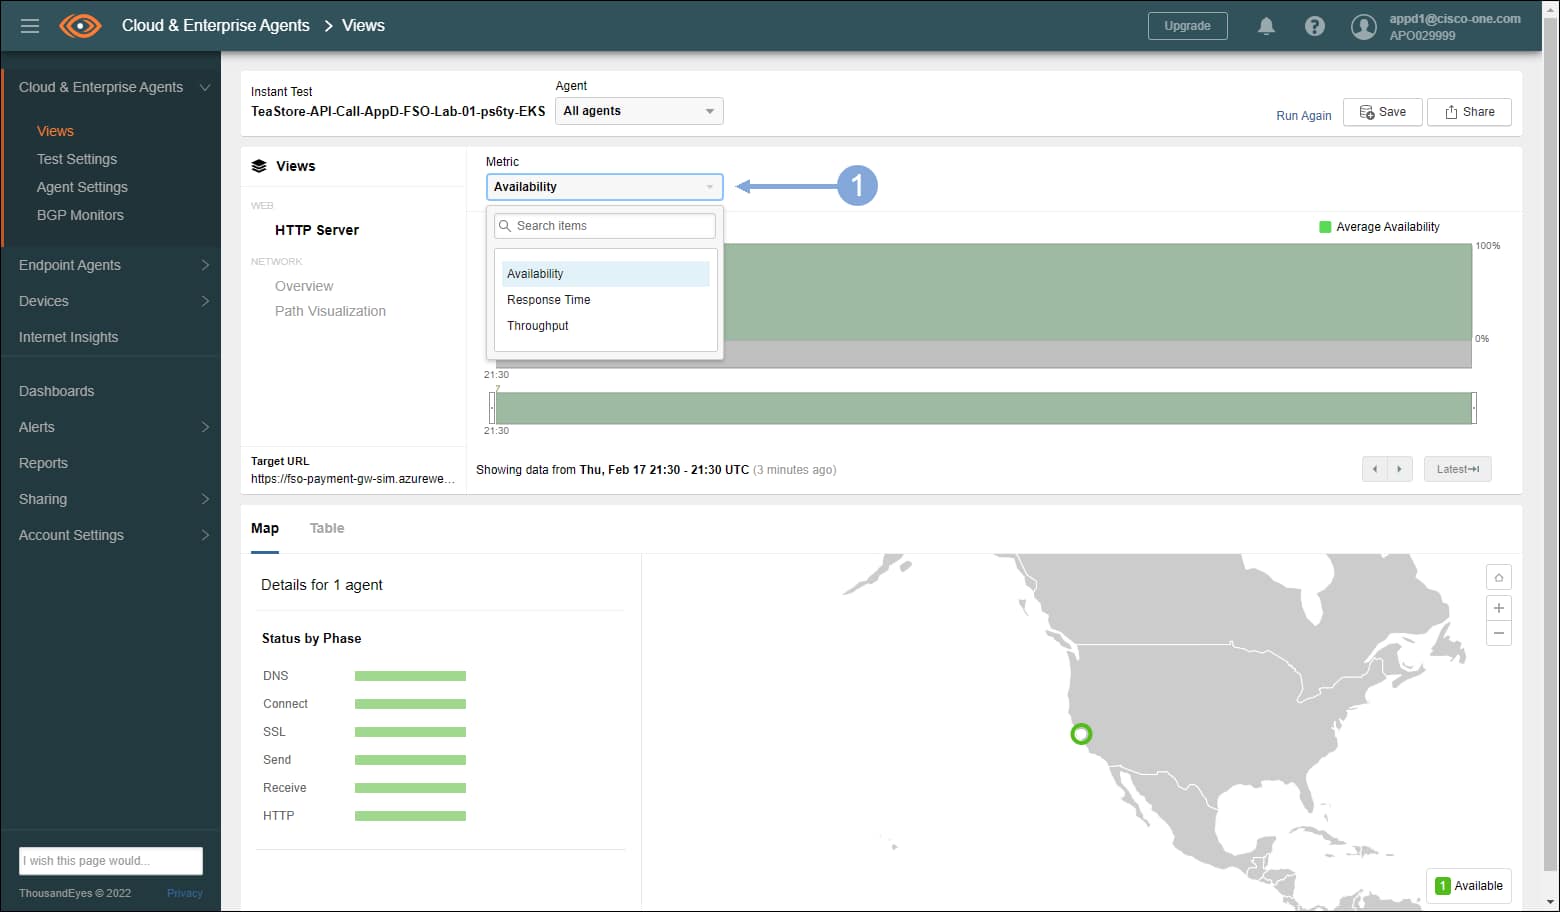
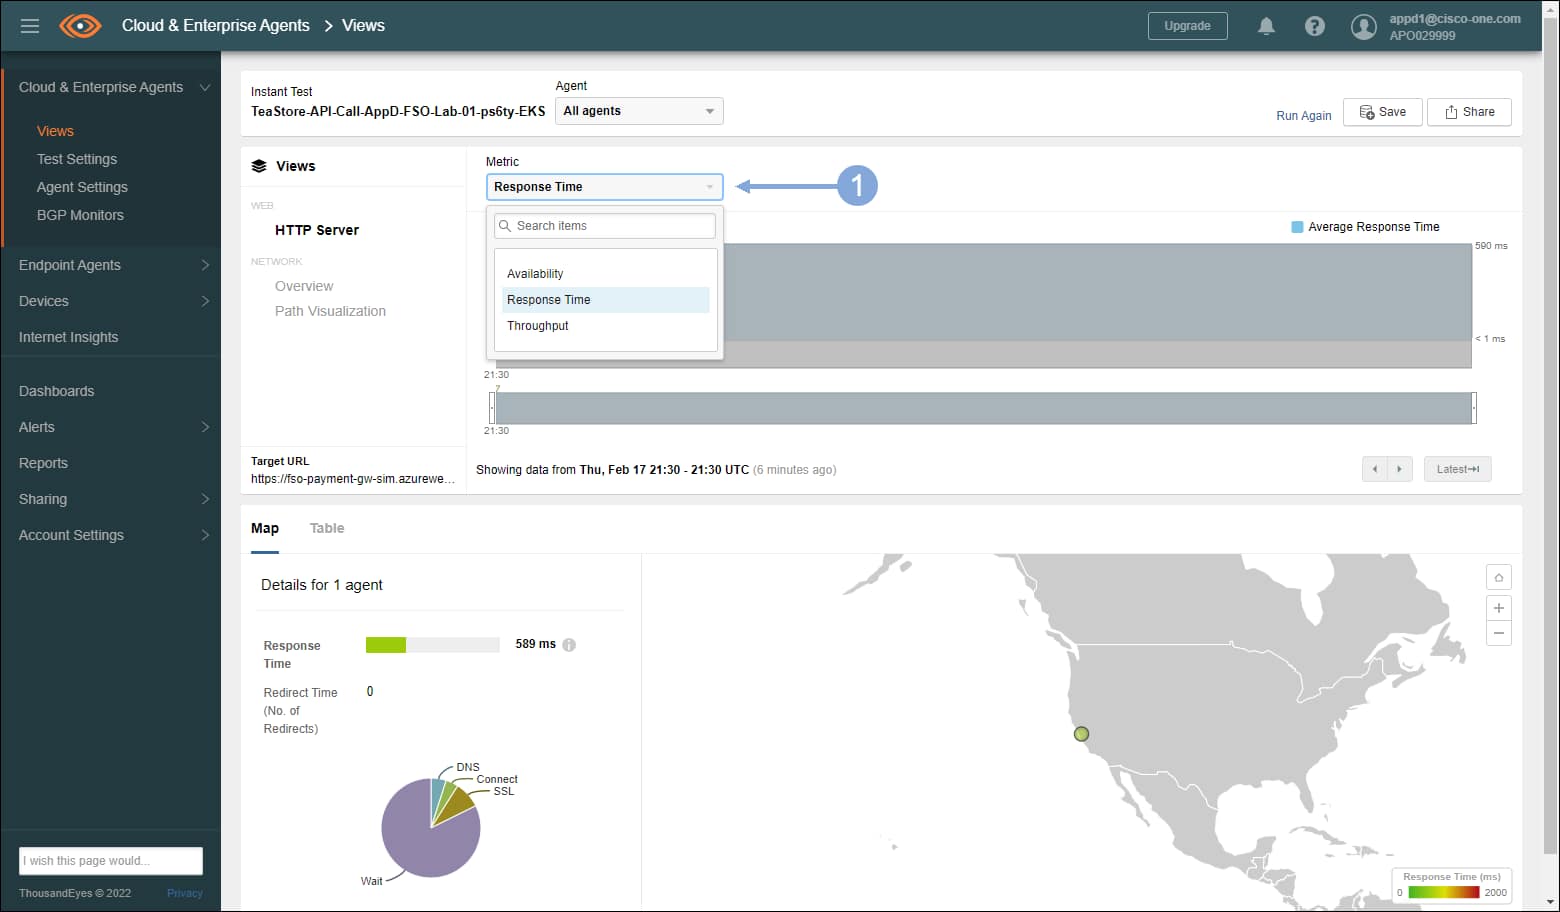
🔵 You can also select the Response time from the pull-down menu
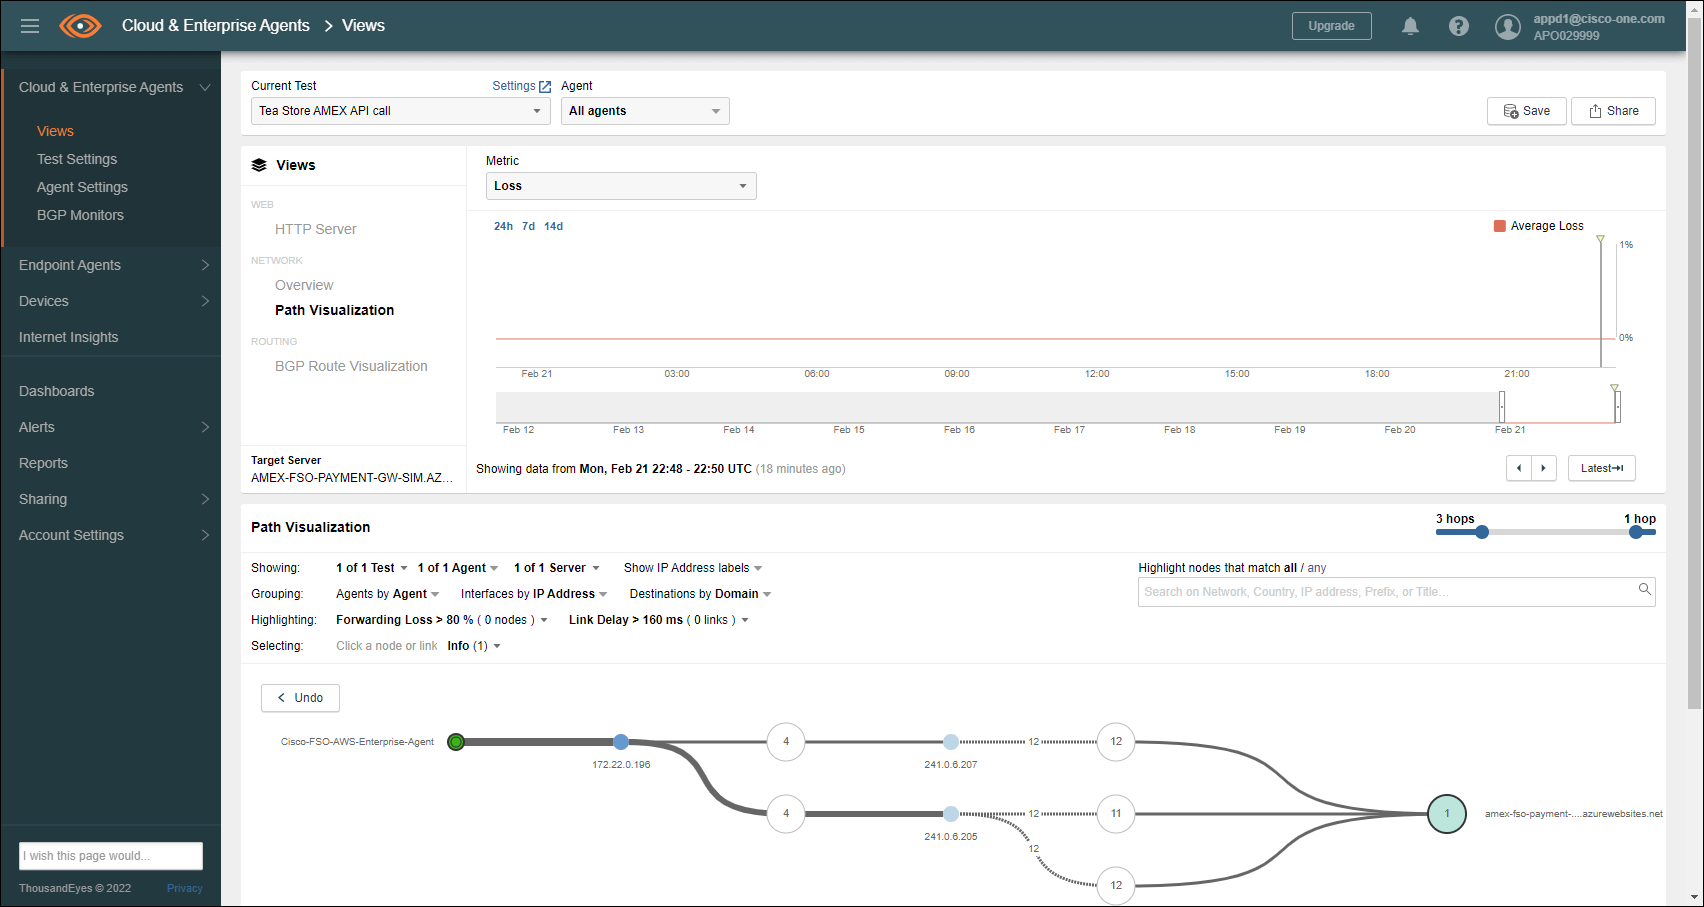
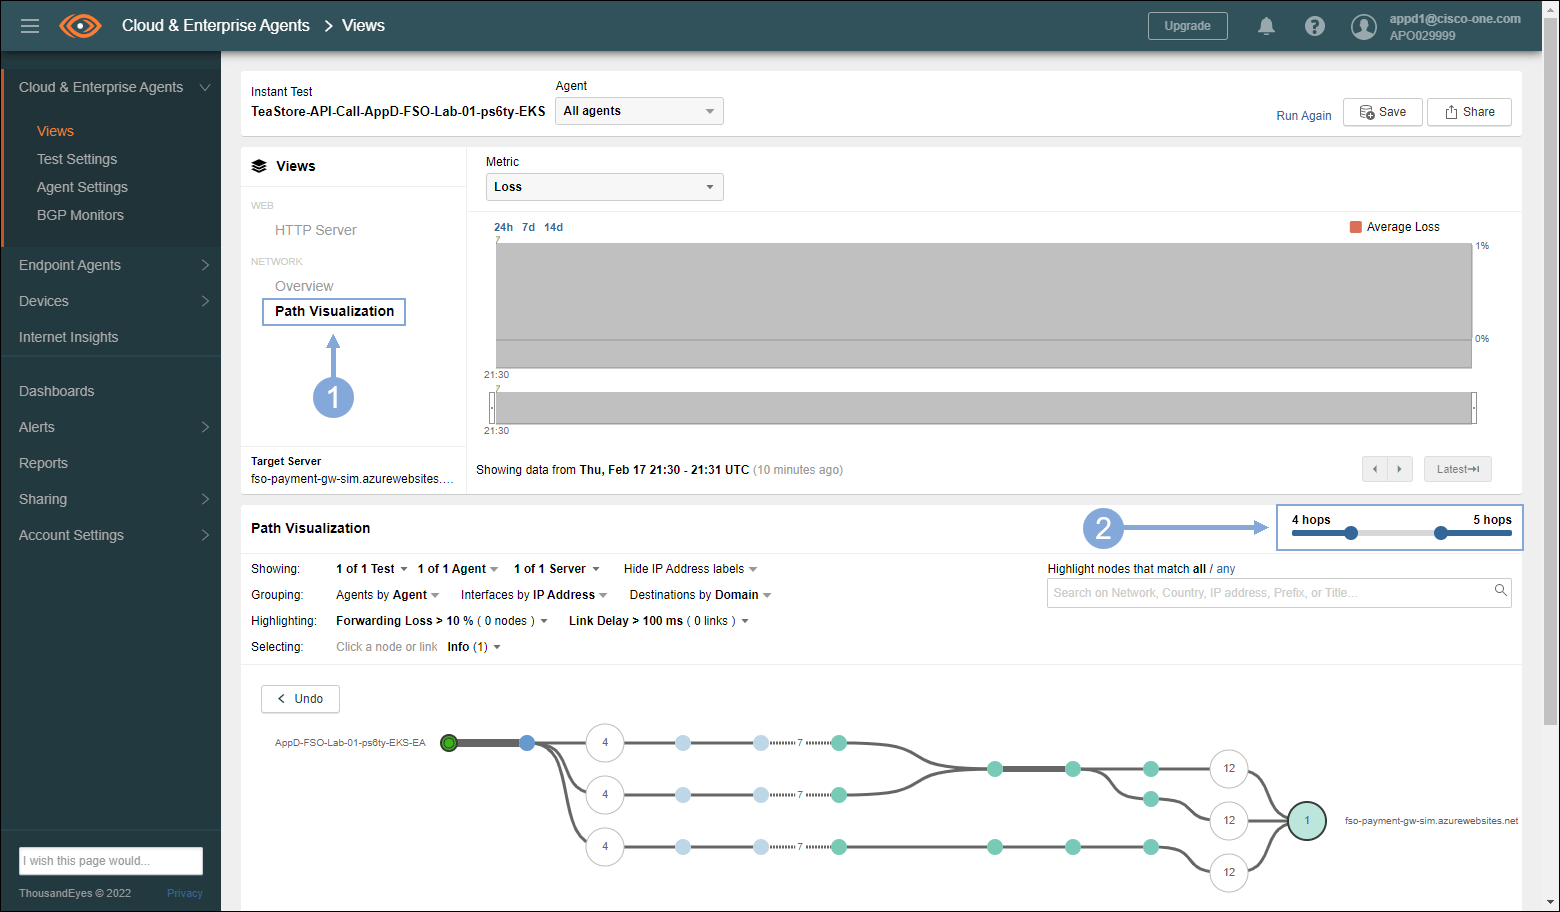
🔵 You can select the Path Visualization View
🔵 In the upper right of the path visualization section, you can get additional path detail by increasing the path hop by sliding the hop bar
Copy ThousandEyes Dashboard

- Click on the ‘Dashboards’ tab on the left menu
- Click on the drop-down menu
- Select the Tea Store shared dashboard
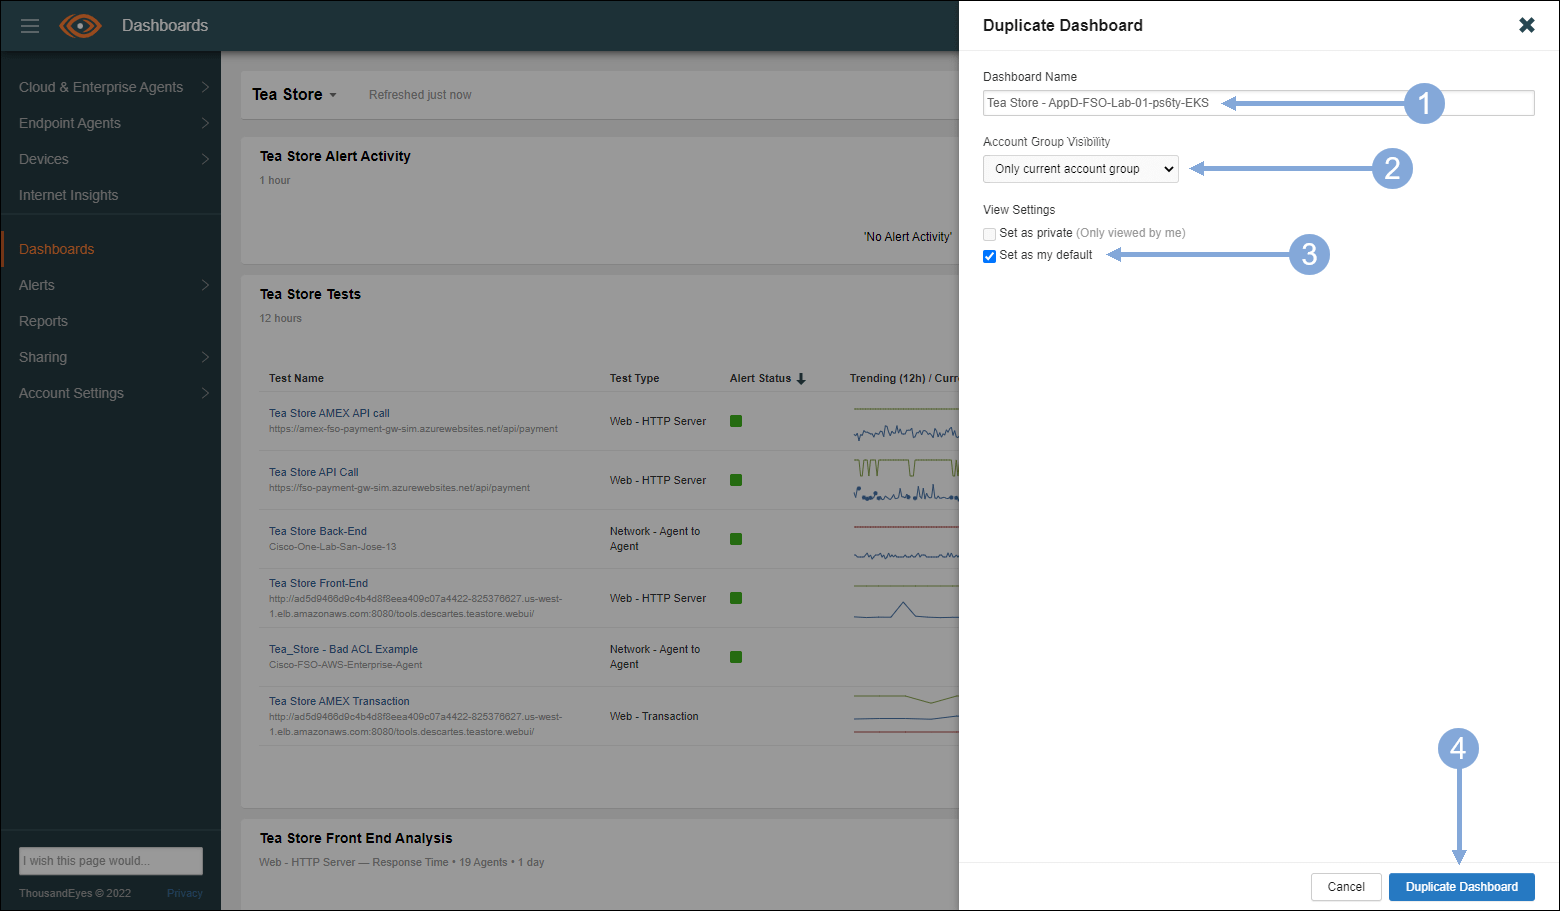
- Click on the three ellipses to the right of ‘Add Widget’ button
- Select ‘Duplicate Dashboard’
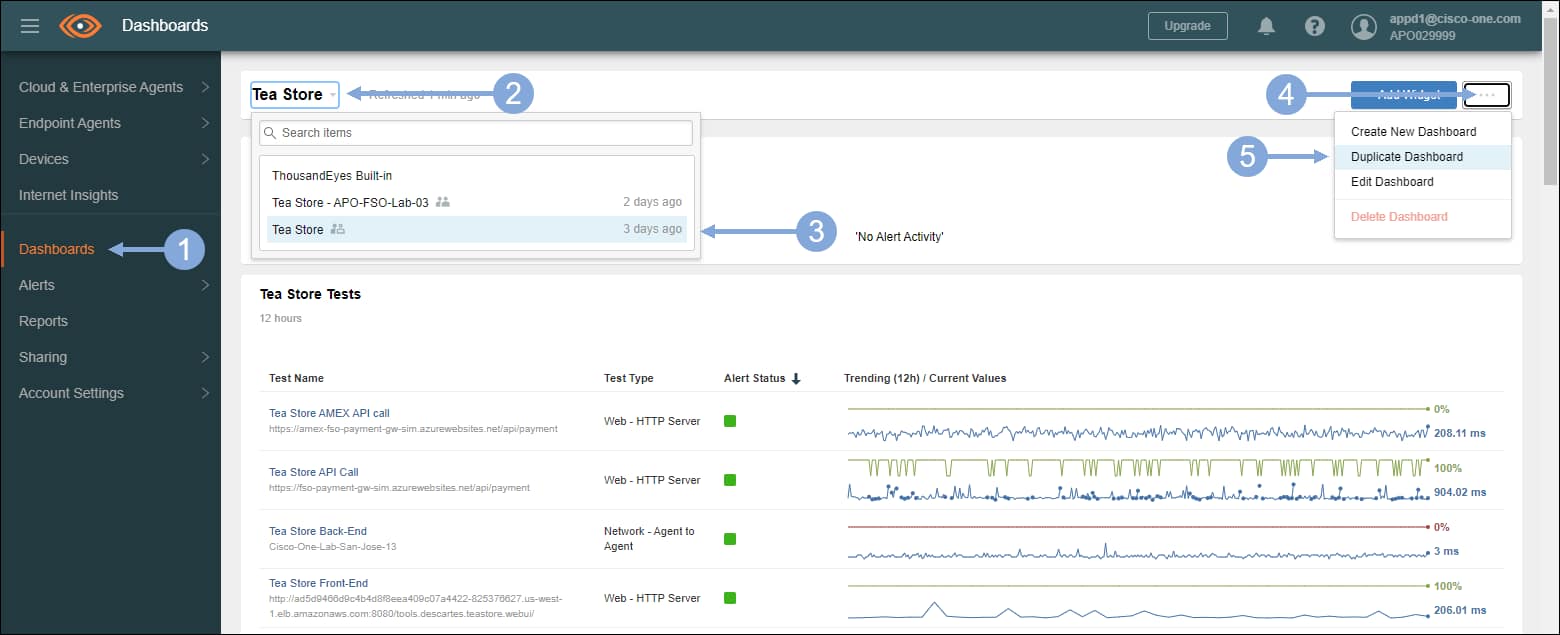

- Name the dashboard ‘Tea Store – ’ and the name of your EKS cluster
- Leave the Account Group Visibility set to ‘Only current account group’
- Check the ‘Set as my default’ checkbox
- Click on the ‘Duplicate Dashboard’ button
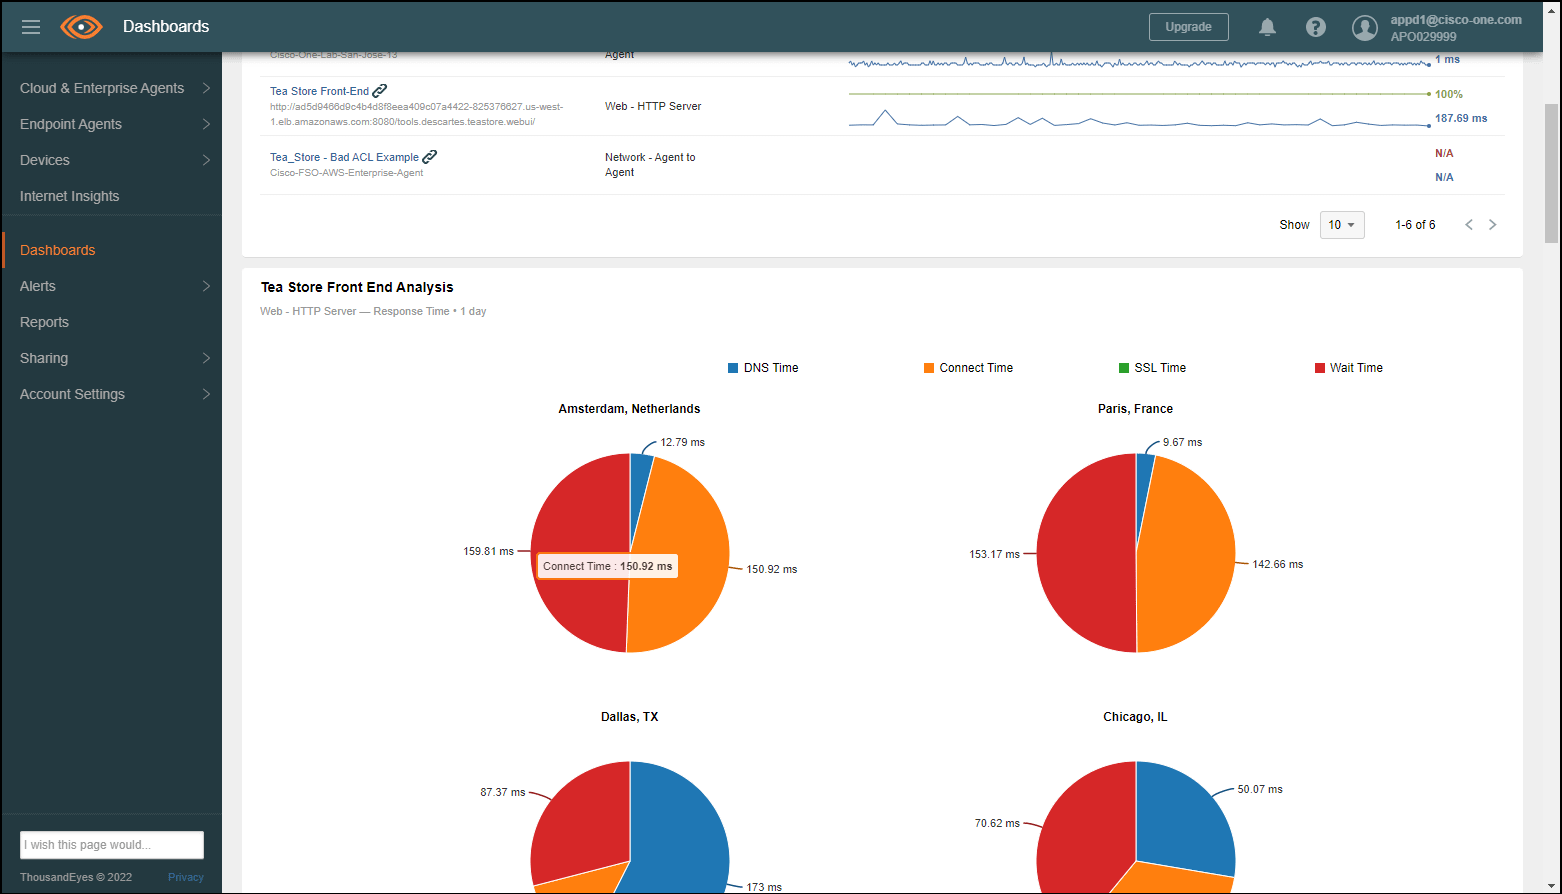
🔵 Scroll down the dashboard and explore the different metrics
Install ThousandEyes Endpoint Agent (Optional)

- Click on Endpoint Agents and then Agent Settings
- Click on the Download button

🔵 Choose the Endpoint Agent for your OS (Windows or Mac OS). Then click on the Installation Guide link for your OS and keep it open in a separate browser window.

Next we’ll look at the results of your configuration with specific observability scenarios.
HANDS-ON
OBSERVABILITY
This use case illustrates the integration with ThousandEyes to illustrate how you can assess the application as experienced by the end-users located around the world.
🔵 Use the credentials for ThousandEyes via OKTA provided by your instructor to login to ThousandEyes if you’ve been logged out. The instructions for logging into OKTA are located at this link: https://fso.cisco-one.com/okta/
HTTP Server View

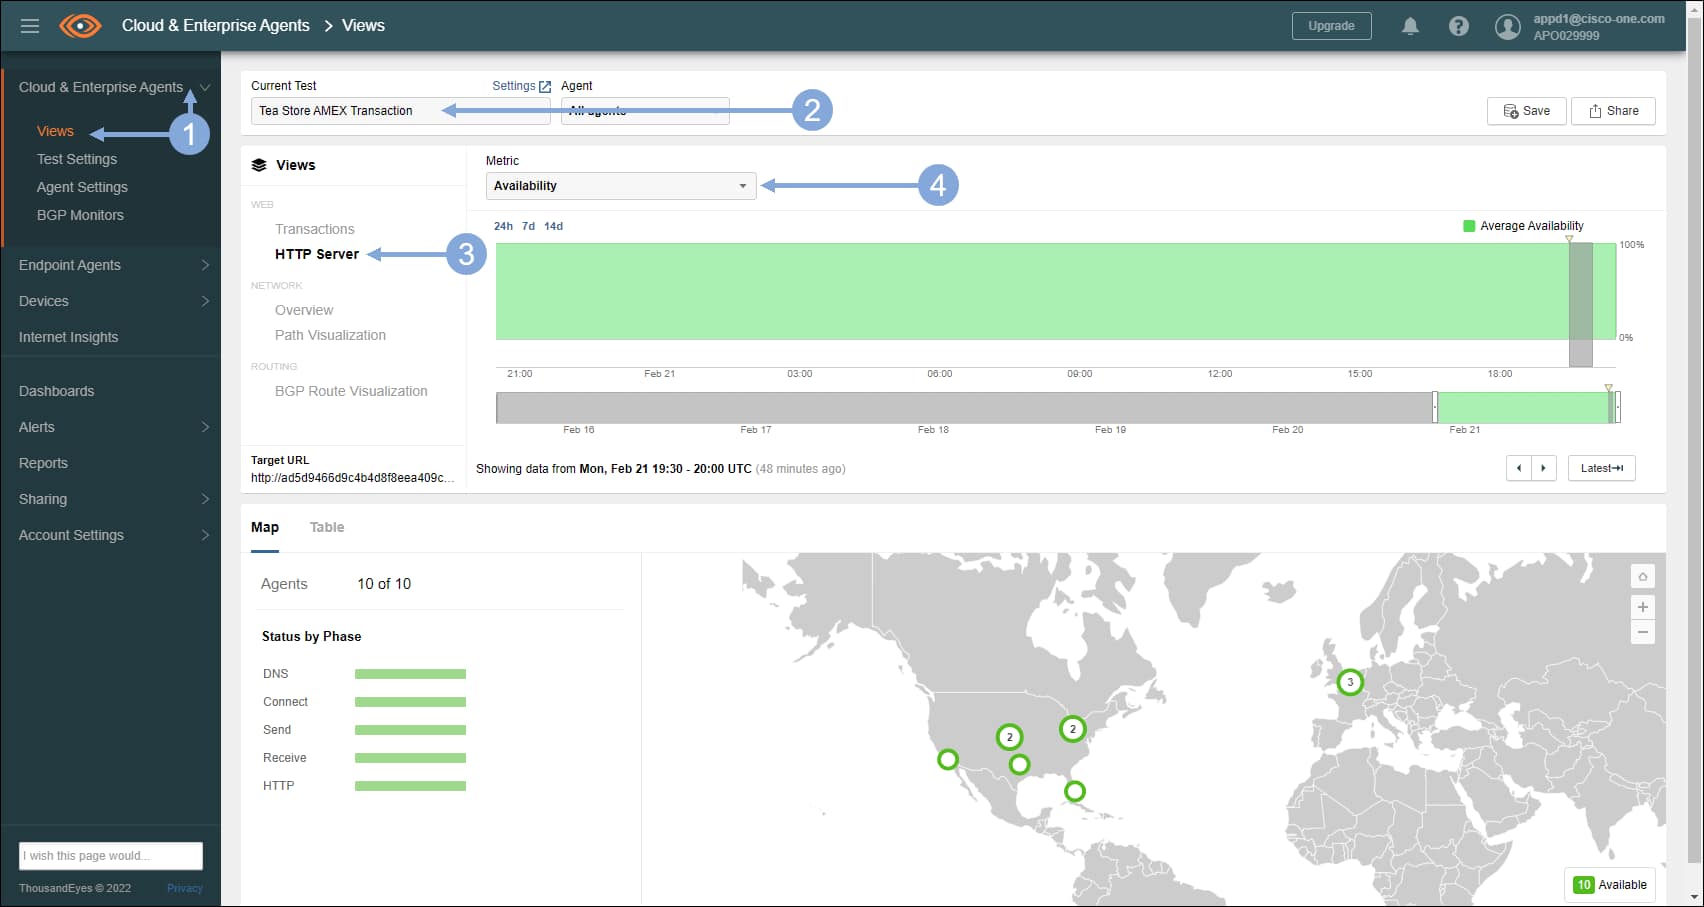
- Click on the ‘Cloud & Enterprise Agents’ and then ‘Views’ on the left menu
- Select the ‘Tea Store AMEX Transaction’ test from the drop-down
- Click on the ‘HTTP Server’ view
- Look at the ‘Map’ area below for each metric in the ‘Metric’ drop-down to see if there are any obvious issues
Transactions View

- Click on the ‘Transactions’ view
- Hover over the red circle in the northeast region of the USA on the map
- Click on ‘Chicago, IL’ to select that agent
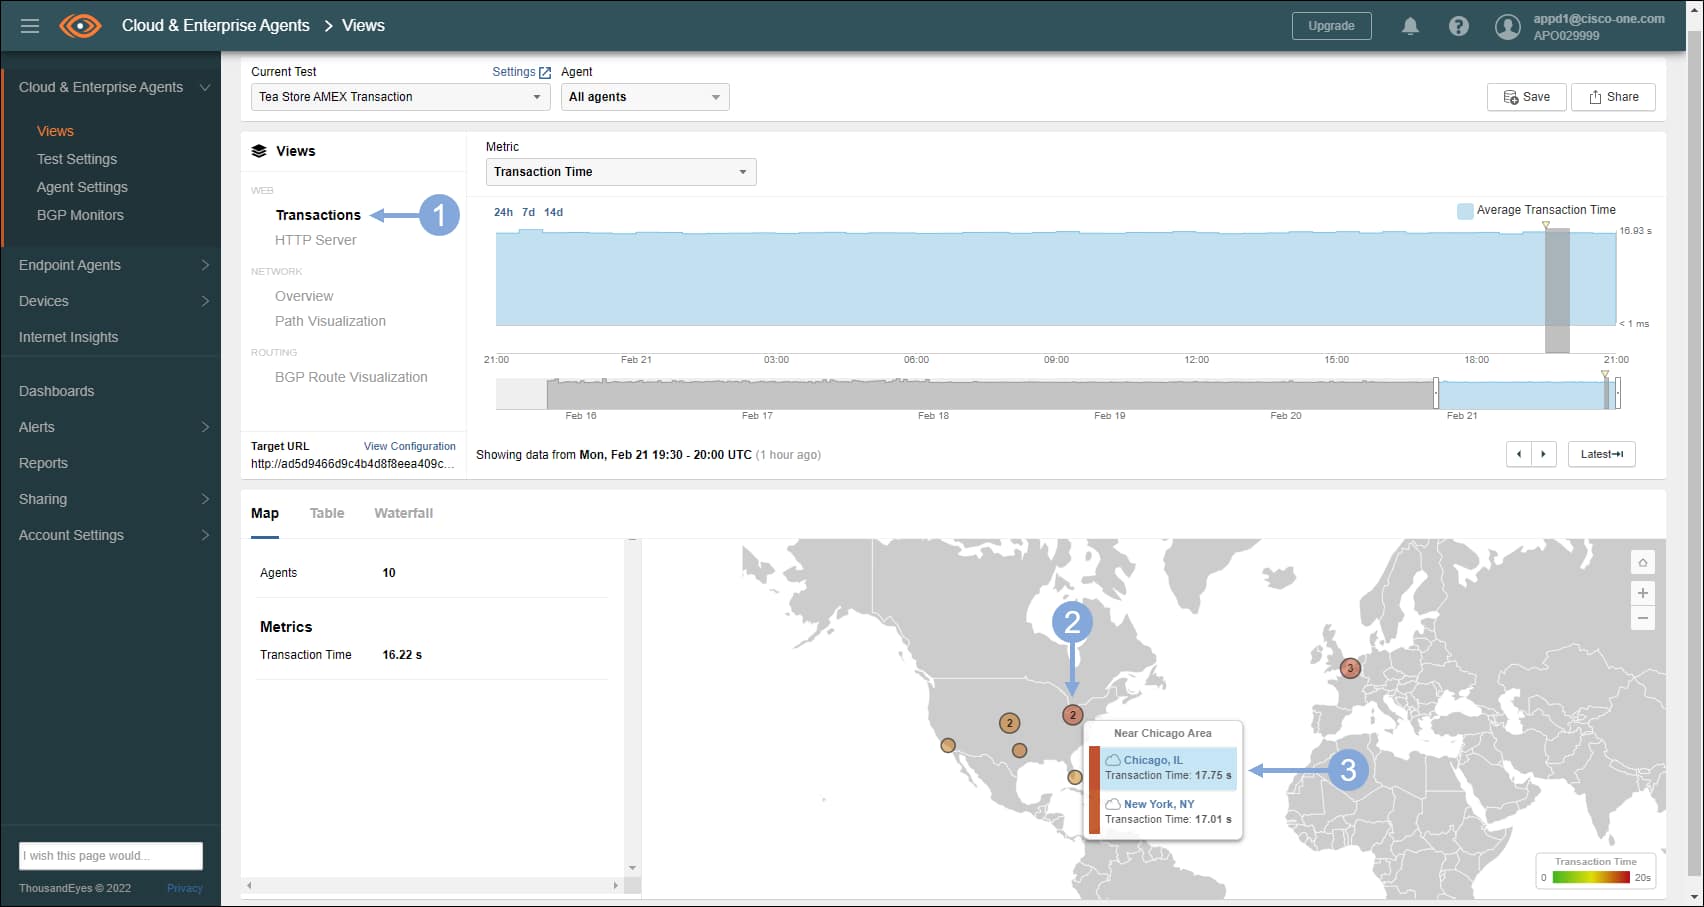
🔵 Next click on Waterfall.
This display represents what the user in Chicago sees in terms of the response time for the transactions of the application. You can see the steps the user goes through and all the components involved in the transactions and the amount of time it takes to complete any of the responses by scrolling down the page.
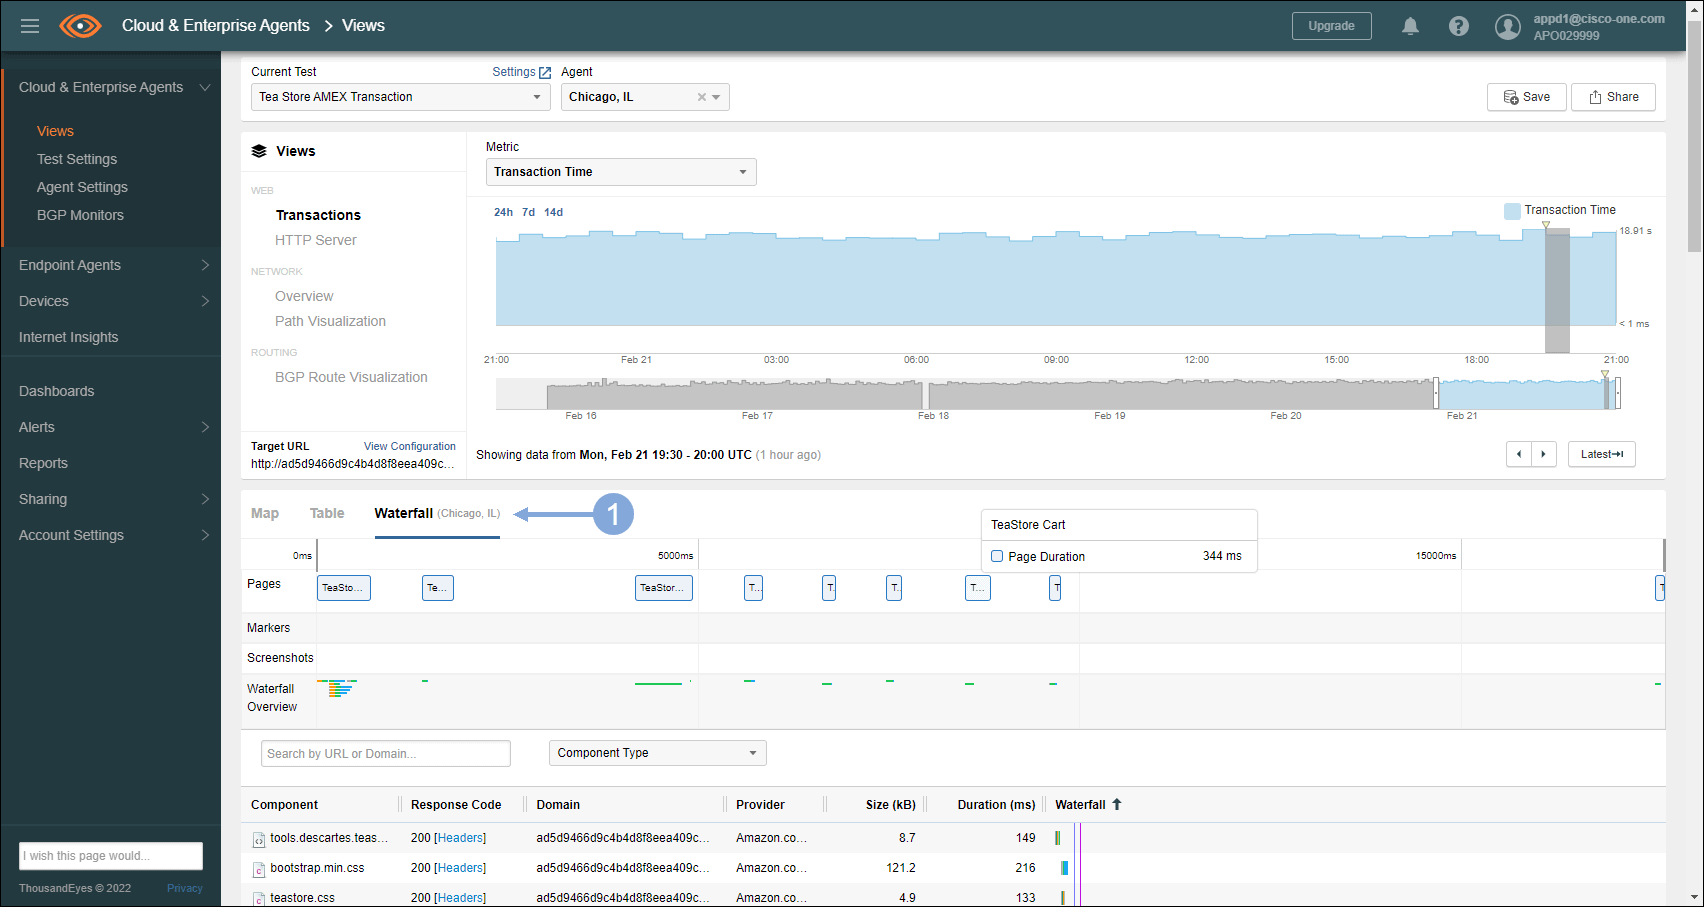
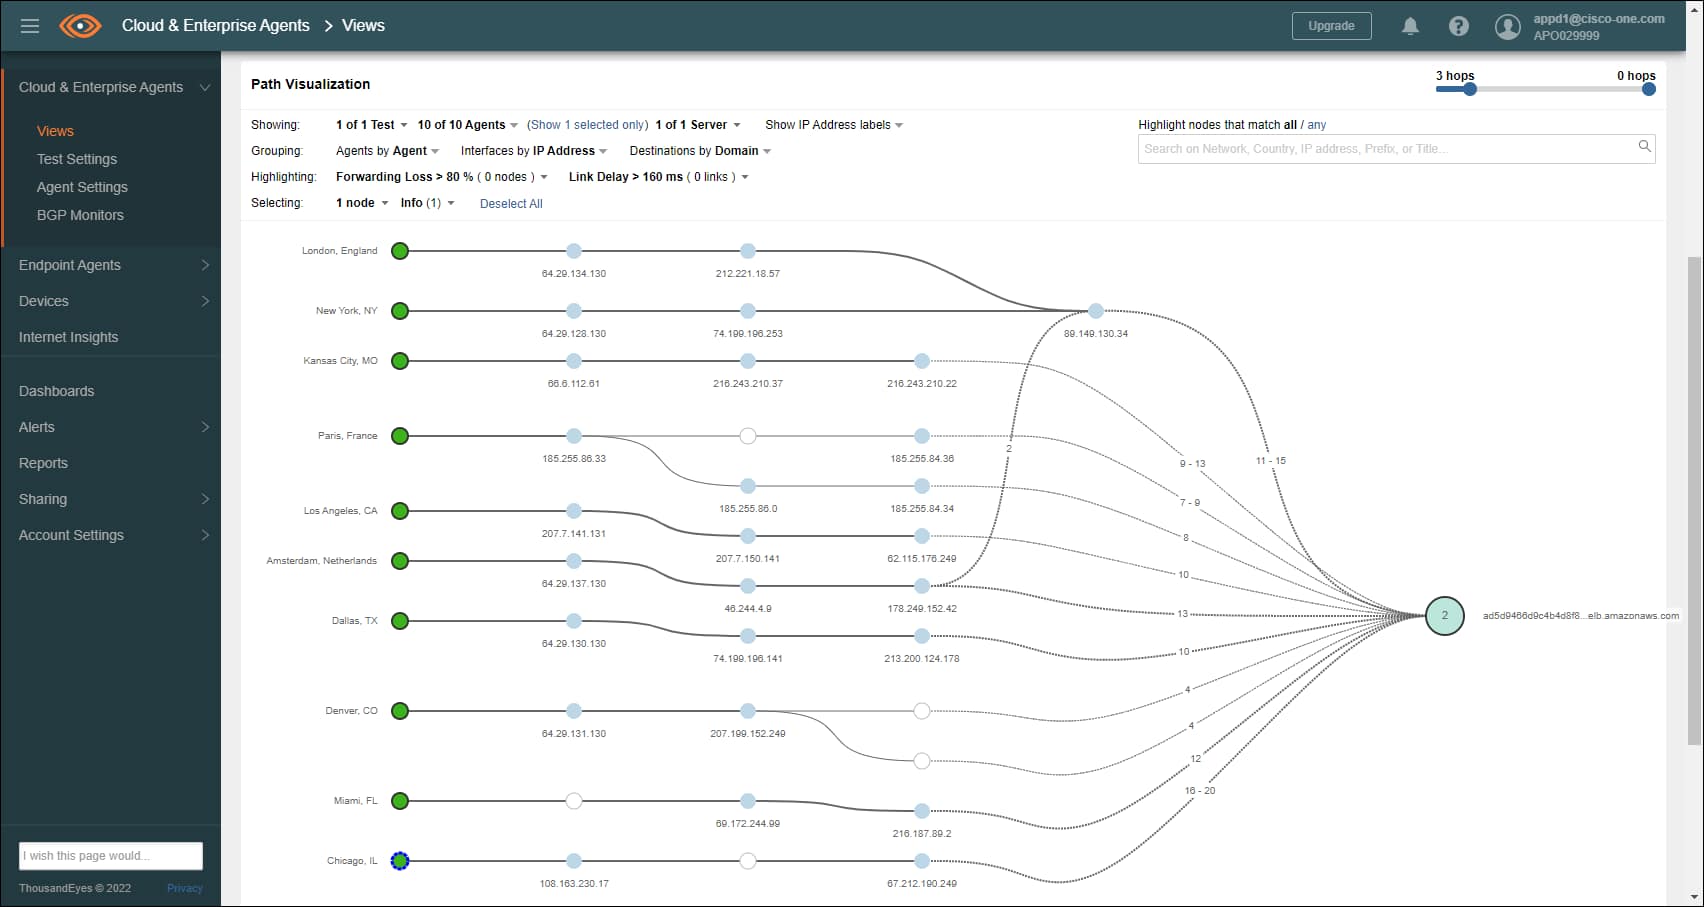
🔵 Next, under Views click Path Visualizations to display the routes the user takes from the WAN

🔵 Scroll down the page to see the actual paths taken.
Looking through the paths there appears to be no issues, so you can assume that the network is not contributing to any problems accessing the front-end of the application.
Next we’ll take a look at the application from an operations viewpoint in the Application Dependency Monitoring use case.
APP DEPENDENCY
MONITORING
Re-factoring Bridge-To-Posibili-Tea’s application has taken Antonia on a journey of using third party services that allows her team to focus on the features that really impact the business bottom line while some of the needed functionalities are fulfilled by services provided by other companies.

Current situation
Although using third-party services releases the team from having to architect, design, code, test, deploy and maintain supporting code, it does not exempt them from owning the performance of those services being used.
This situation adds a degree of complexity to the operation of the business as functionalities needed by the business are not controlled internally, leaving the operations team with SLAs as the sole source of quality control.
From Bridge-to-Posibili-Tea’s perspective their visibility ends the moment the request for services to third parties leave their infrastructure (whether it is in the cloud or on premises) so, if there are problems they are unable to triage those as they will not be able to tell if the issue is happening with the data in transit (while the request is being transported to the third party or the result is being delivered back to them) or at rest (when the request reaches the third party service and is processed).
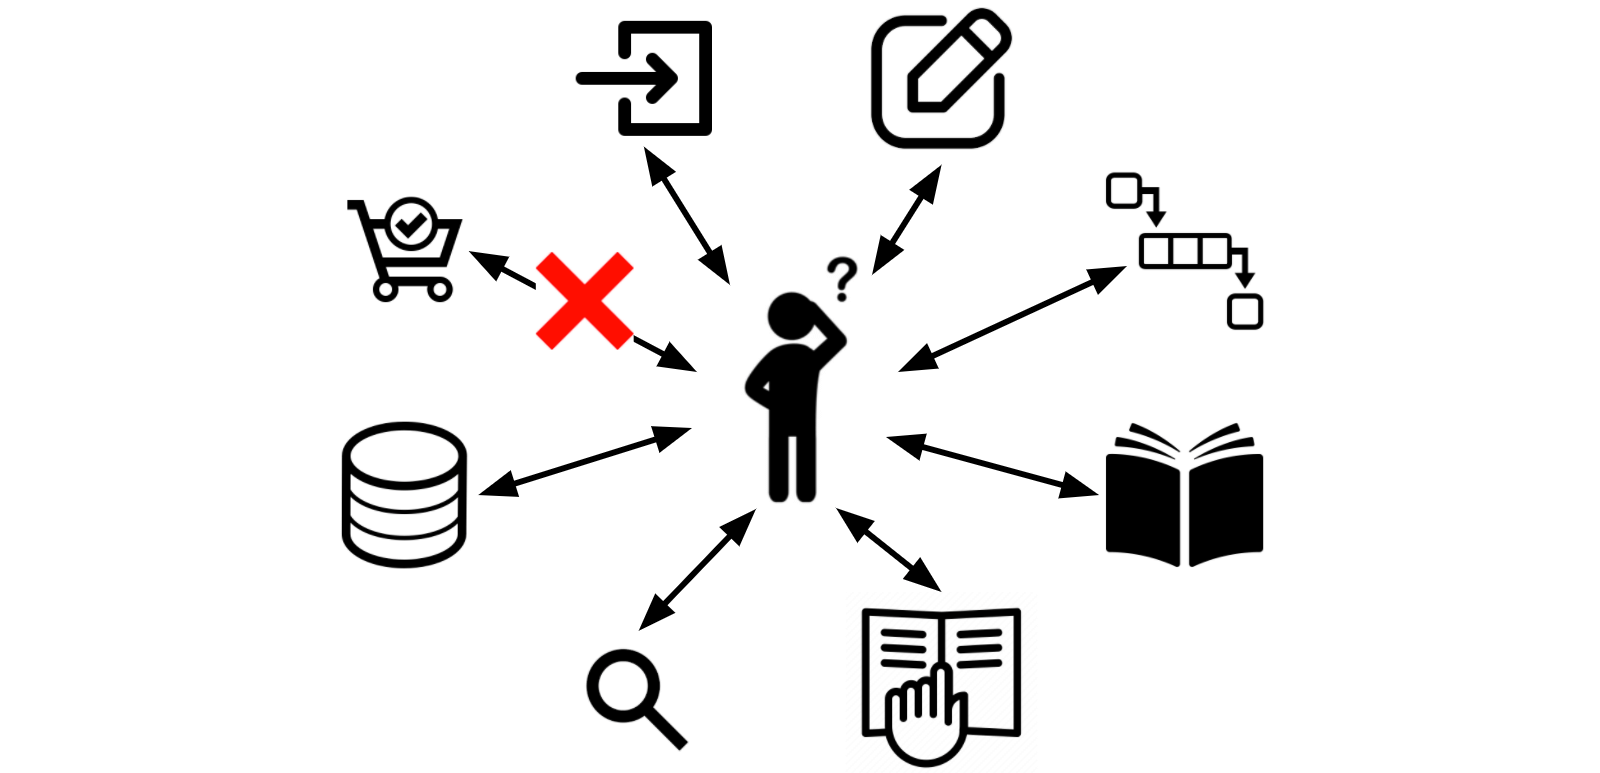
Cisco’s FSO - Dependency Monitoring
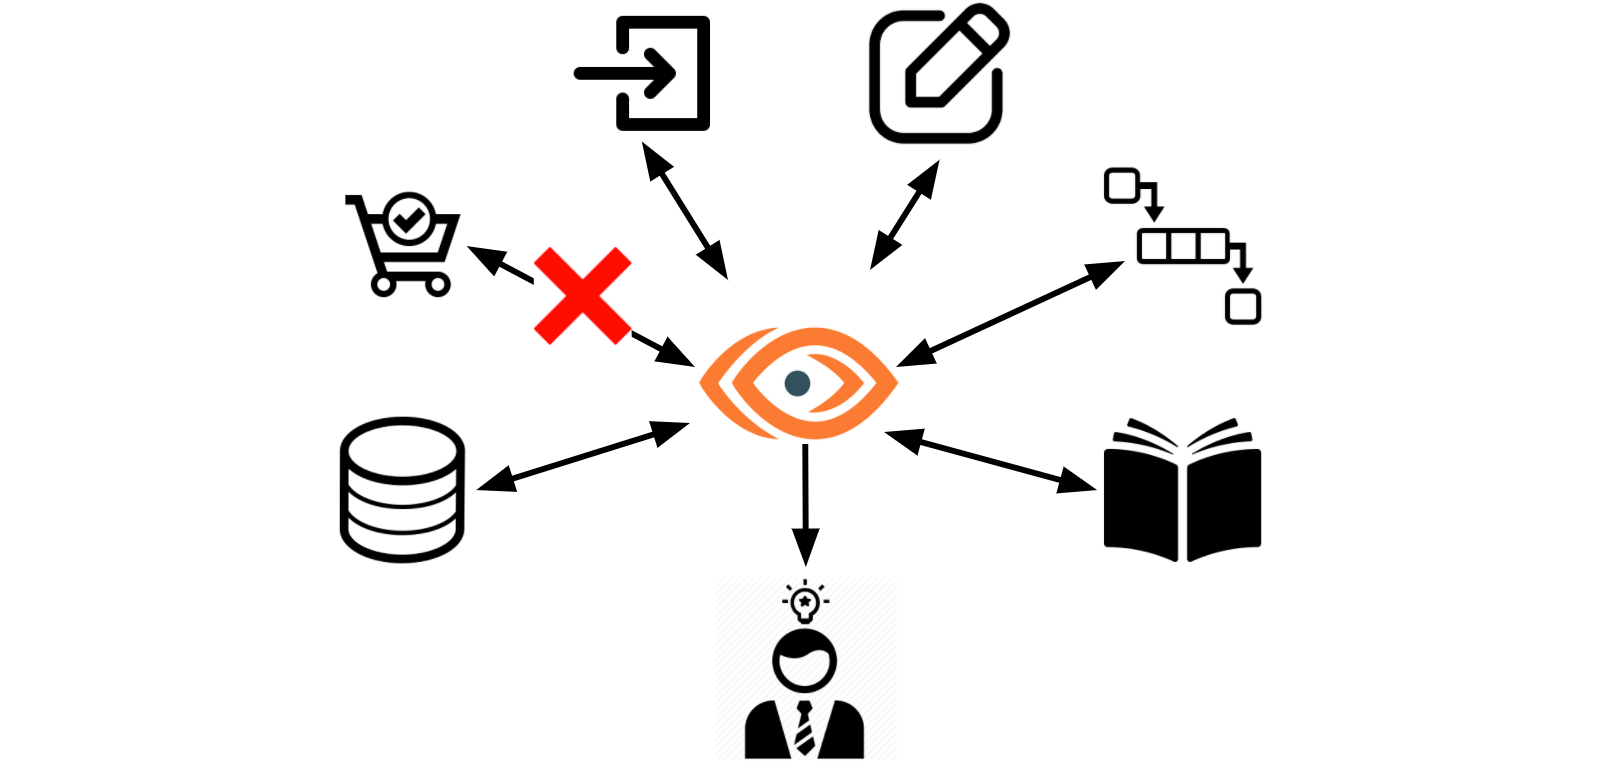
Cisco’s FSO – Dependency Monitoring solution includes ThousandEyes which allows you to gain deep visibility into the performance of data in transit through a network of agents spread all around the globe along with enterprise agents installed in the customer’s infrastructure which provide insights to what kind of issues your data is finding while moving through the internet.
These insights enable customers to very easily, quickly and intuitively understand if performance issues observed with interactions with third-party services are due to problems in the public/private internet or if they are happening at rest (when the third parties are actually processing the requests).
This triage ability provides customers with undisputable data that will allow them to timely react and document their response according to the circumstances.
Why should Antonia care?
If Antonia is blind in regards to why a third-party service is presenting a performance degradation then there is little leverage he has while raising the issue to them. Being able to articulate any claim with solid data enables Antonia to address third-party-services’ issues in a assertive way which leads to MTTR reduction.
Giving the increasingly dependency modern applications have with the ecosystem of services provided by others it is very important to be able to have a verifiable understanding of the circumstances under which a third-party service degrades such that the appropriate corrective actions can be taken in a timely manner.
Next we’ll see how AppDynamics and ThousandEyes provides you with the visibility to quickly identify issues with third party services to get to root cause.
HANDS-ON
OBSERVABILITY
This use case examines an API that the application uses to process credit card payments with a third-party application.
🔵 Use the credentials used previously to login to the AppDynamics controller if you’ve been logged out.
Payment API Availability
🔵 Open your TeaStore FSO Dashboard using the steps below.
Click on the ‘Dashboards & Reports’ tab on the top menu
Double-click on the dashboard you see in the list (there should be only one)

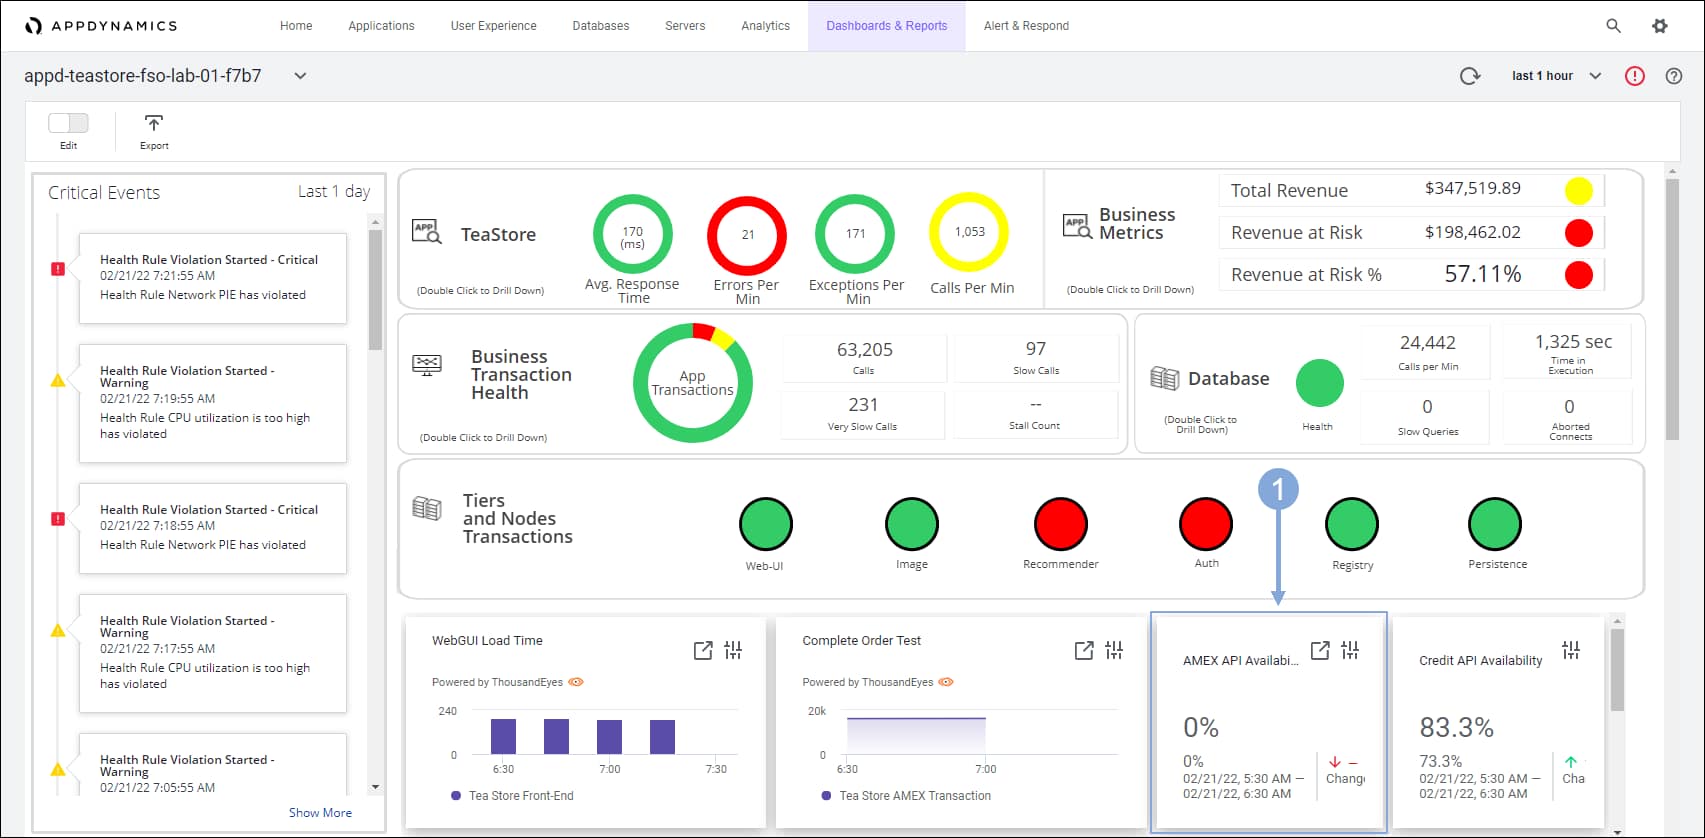
🔵 Scroll to the tiles below Tiers and Node Transactions and notice that the AMEX API Availability is 0 percent.
This percentage means that any application component that uses this API cannot complete a transaction.
Diagnose with AppDynamics
🔵 Use the steps below to navigate to your TeaStore application.
Click on the ‘Applications’ tab on the top menu
Find your TeaStore application with your lab number in the name and click on its name to open it

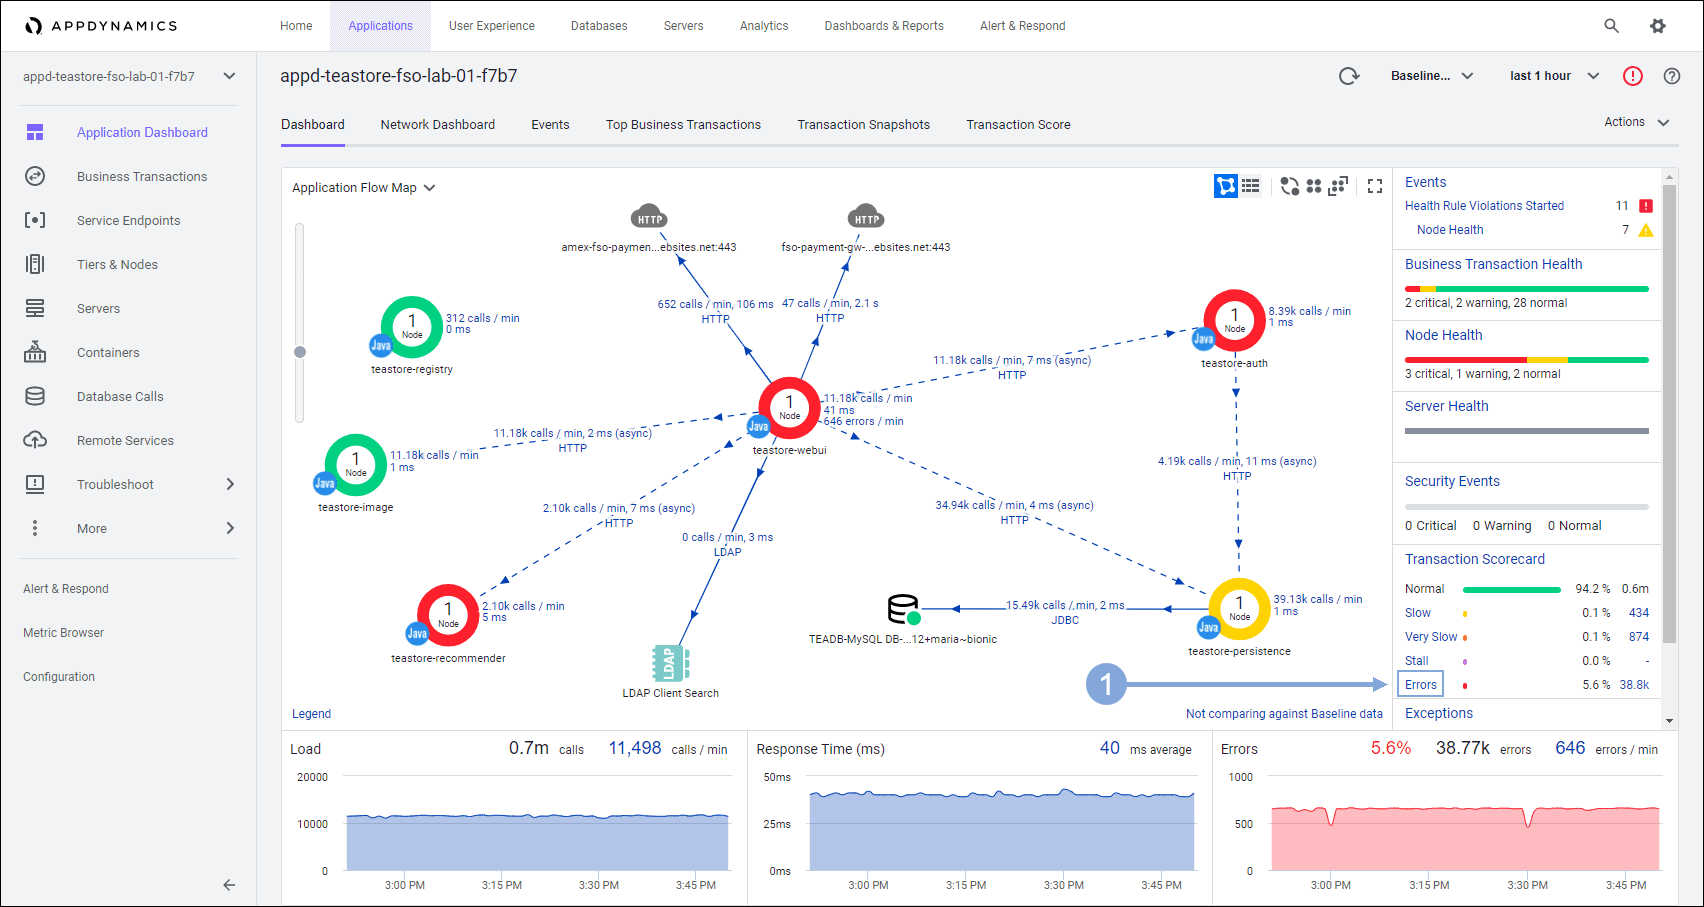
🔵 Now let’s use AppDynamics deep diagnostic capabilities to understand if the issue with the AMEX API service stems from within the application iteslf.
- Click on ‘Errors’ under the ‘Transaction Scorecard’
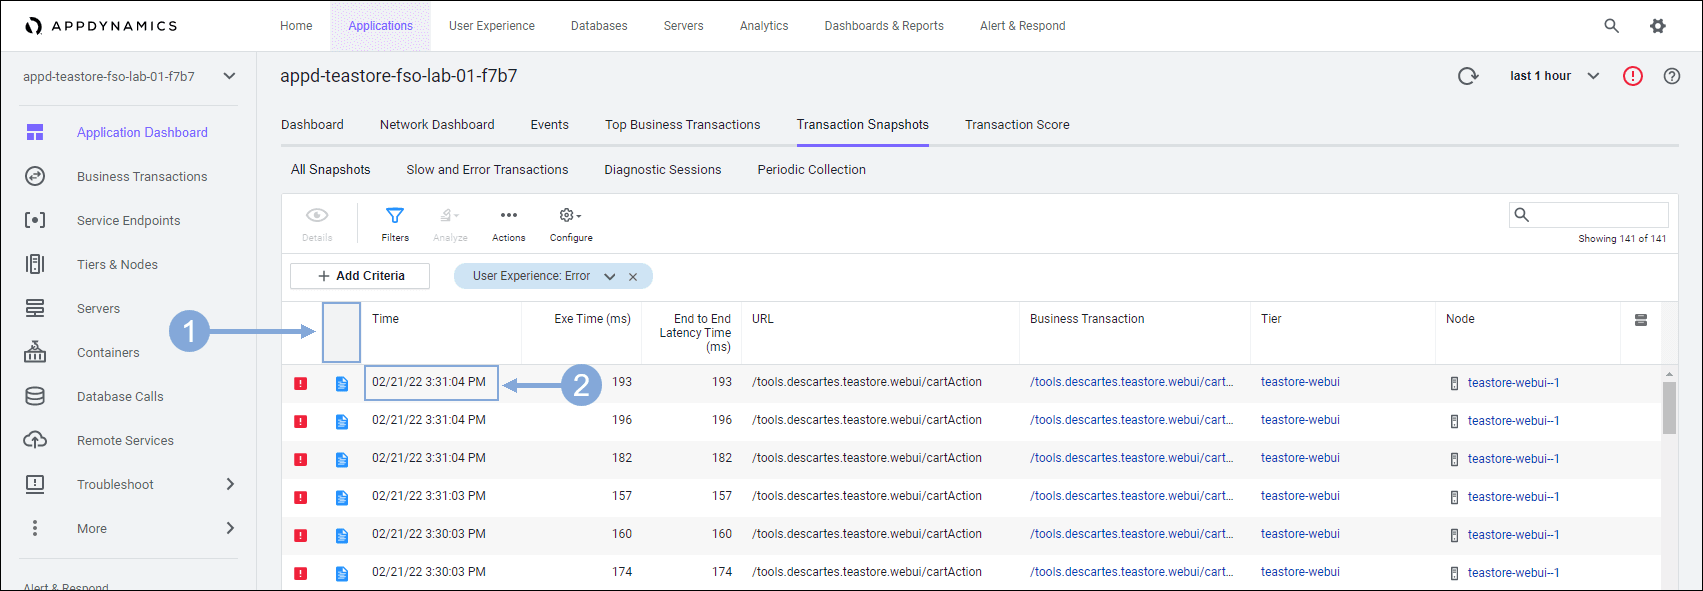
🔵 Use the steps below to open a Transaction Snapshot that involves a call to the AMEX API service.
- Click on the column indicated to sort the snapshots so the call graphs are at the top of the list
- Call graphs are indicated by the blue page icon
- Double-click on the snapshot at the top of the list to open it

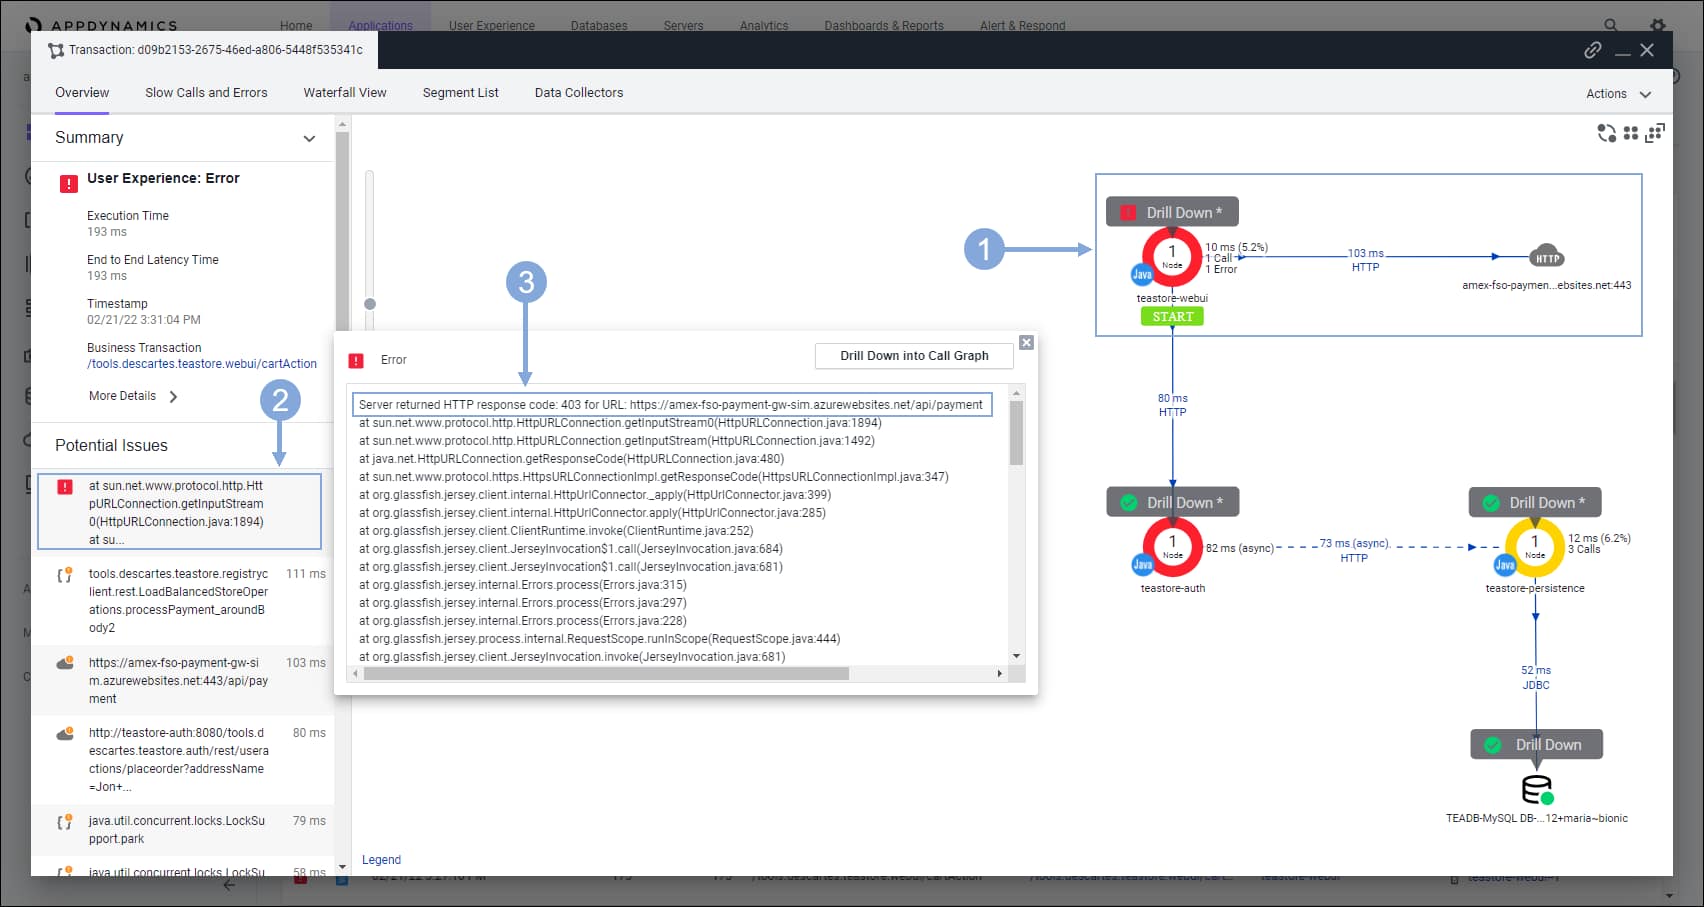
- Notice there was an error when the ‘teastore-webui’ tier called the AMEX API service
- Click on the error at the top of the ‘Potential Issues’ list on the left
- Now you see a 403 error that is related to the AMEX payment processing
A list of possible reasons for the 403 error follows:
- The API may be unavailable
- Errors may be occurring in our network that prevents the call to the AMEX processing reaching that processing
- The infrastructure between our network and the target is experiencing problems, which require investigation with the ISPs between the TeaStore application and the target service
Diagnose with ThousandEyes


- Click on the ‘Cloud & Enterprise Agents’ and then ‘Views’ on the left menu
- Select the ‘Tea Store AMEX API call’ test from the drop-down
- Hover over the red circle on the map to inspect the details
- In the left part of the display under Views click Path Visualization
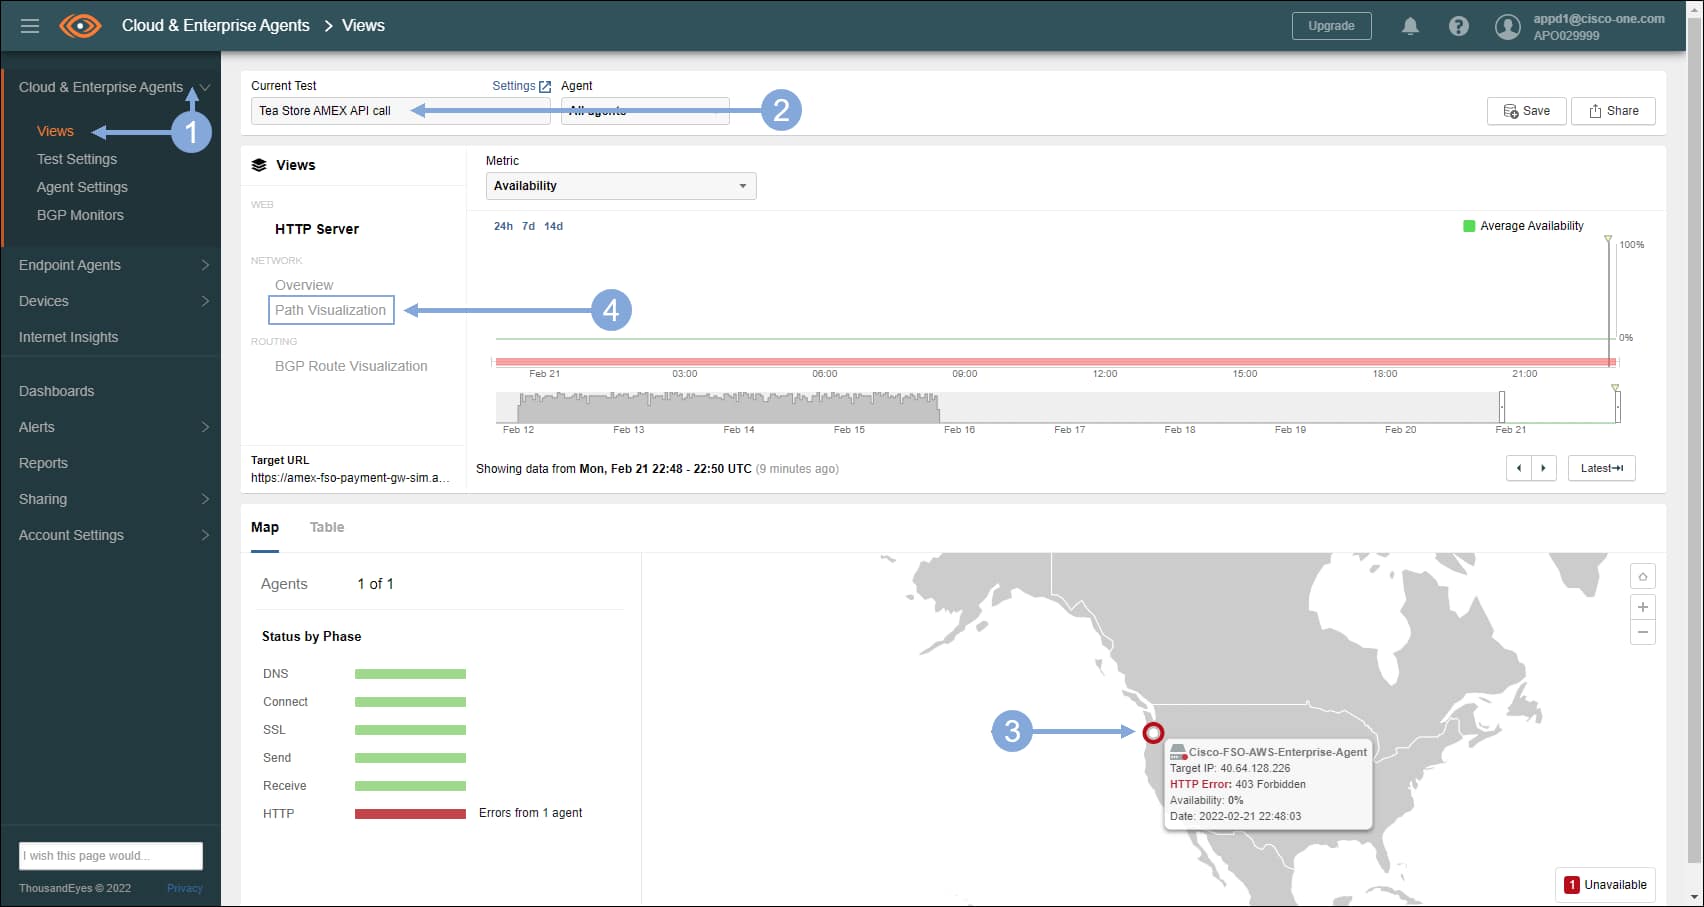
🔵 You see that users can access the front end of the application without problems.
The network on our end is fine. The displayed paths indicate that the problem resides with the third-party application. When the API becomes available again ThousandEyes updates the tile in AppDynamics indicating the availability.
The integration between ThousandEyes and AppDynamics provides you with a way to monitor whether any dependencies are meeting their service level agreements (SLA).
